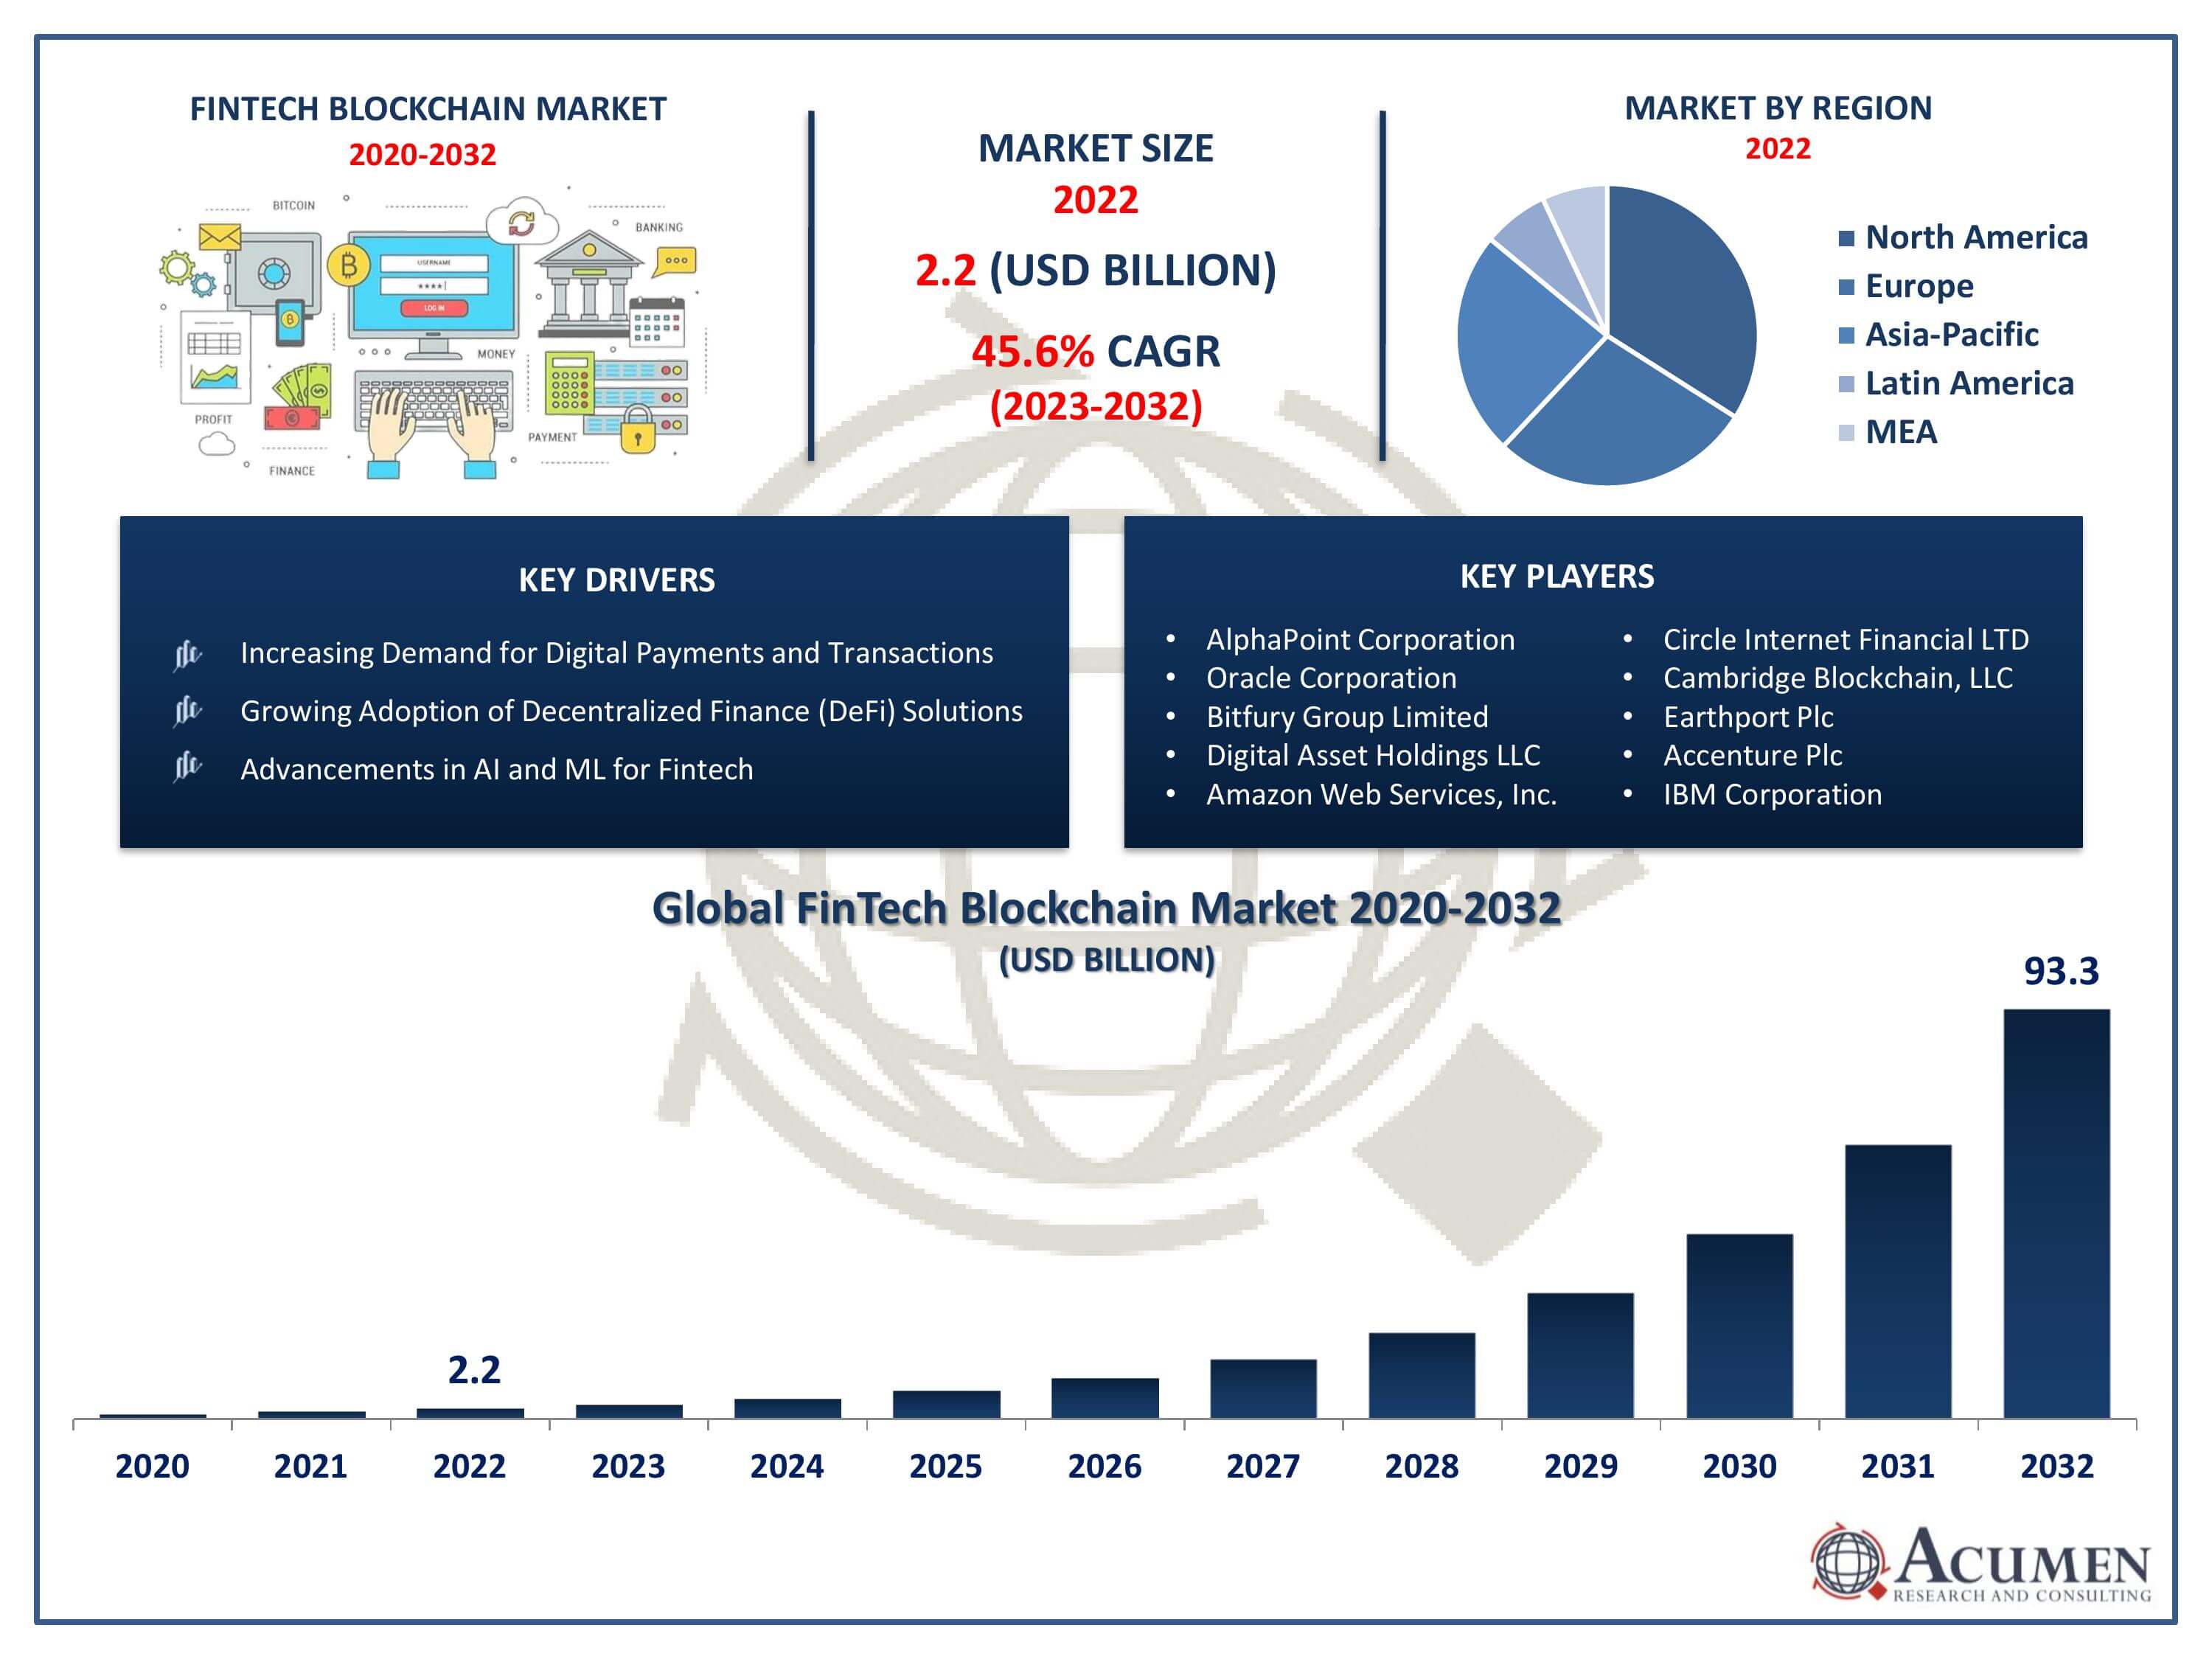
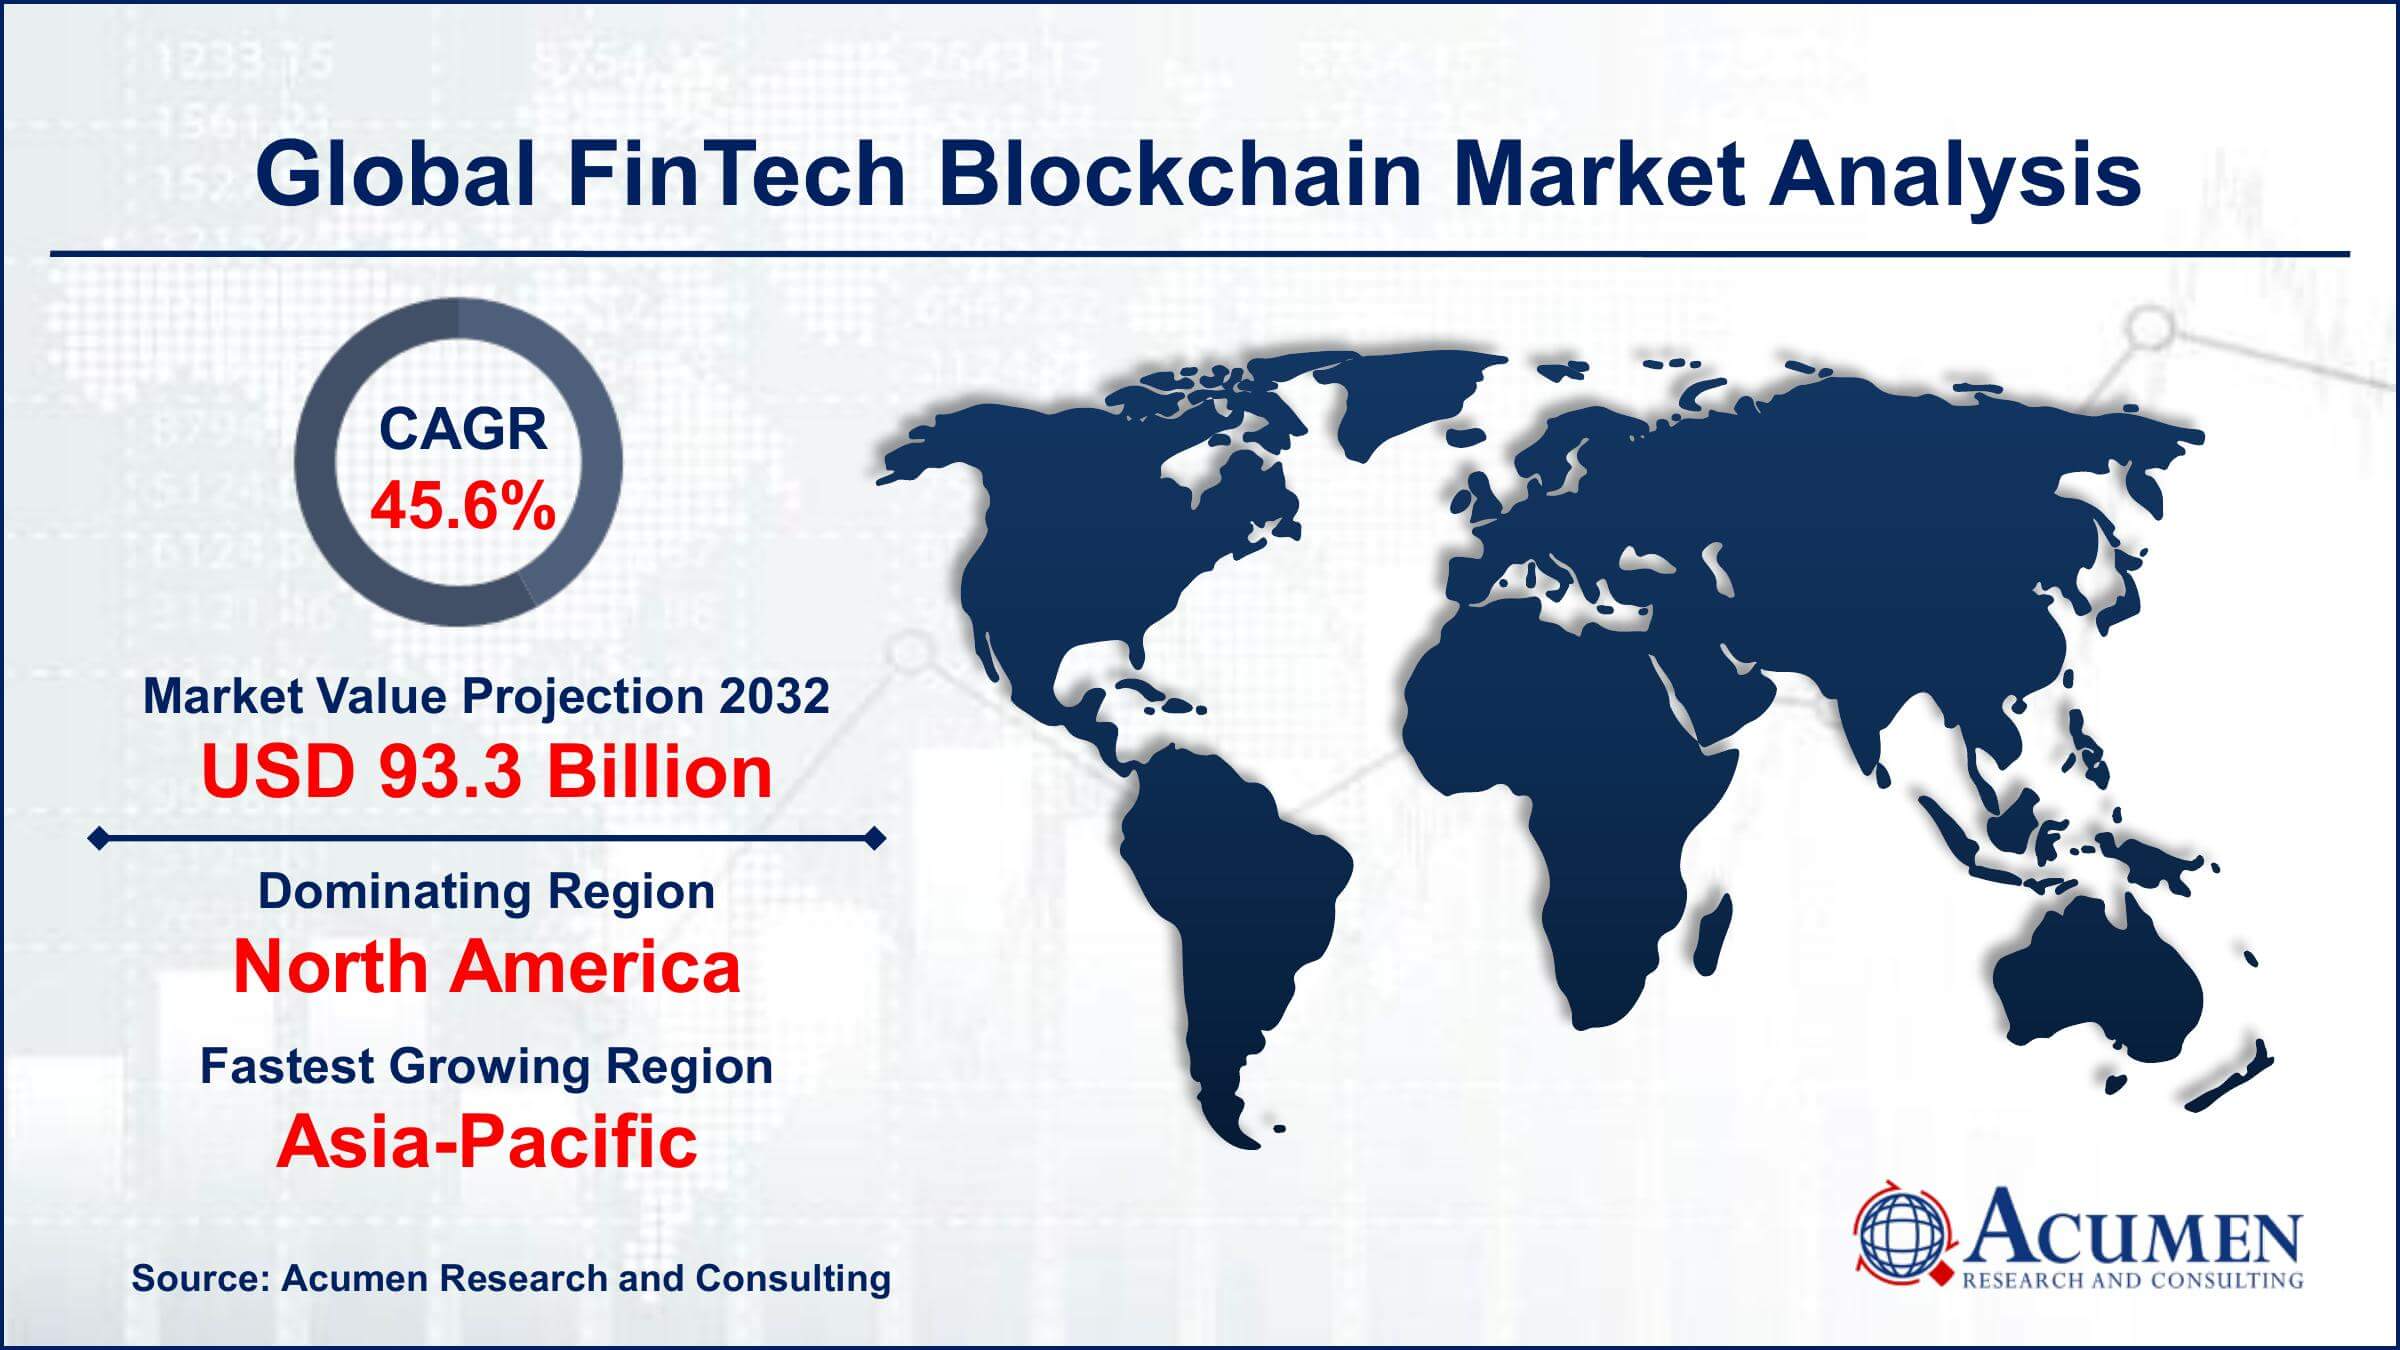
The FinTech Blockchain Market Size accounted for USD 2.2 Billion in 2022 and is projected to achieve a market size of USD 93.3 Billion by 2032 growing at a CAGR of 45.6% from 2023 to 2032.
FinTech Blockchain Market Highlights
- Global FinTech Blockchain Market revenue is expected to increase by USD 93.3 Billion by 2032, with a 45.6% CAGR from 2023 to 2032
- North America region led with more than 43% of FinTech Blockchain Market share in 2022
- Asia-Pacific FinTech Blockchain Market growth will record a CAGR of around 47% from 2023 to 2032
- By verticals, the banking segment held the highest revenue share of 52% in 2022
- By organization size, the SMEs segment is expected to grow at a remarkable CAGR of 46.3% over the predicted period
- Increasing demand for digital payments and transactions, drives the FinTech Blockchain Market value
Fintech, short for financial technology, refers to the innovative use of technology to provide financial services and solutions. Blockchain technology, on the other hand, is a decentralized and distributed ledger system that enables secure and transparent recording of transactions across multiple computers. In the context of fintech, blockchain technology is revolutionizing the way financial transactions are conducted. It ensures the integrity and security of financial data, reduces the need for intermediaries like banks, and allows for faster and more efficient cross-border transactions. By utilizing blockchain, fintech companies can create decentralized applications for various financial services, such as payments, lending, and remittances, offering users greater convenience, security, and cost-effectiveness.
The market growth of fintech blockchain solutions has been remarkable in recent years. As businesses and consumers increasingly recognize the potential of blockchain technology in the financial sector, investments and developments in fintech blockchain solutions have surged. The market has witnessed a proliferation of startups and established financial institutions integrating blockchain into their services, leading to a wide range of innovative applications. These include cryptocurrency exchanges, smart contracts, supply chain finance, and decentralized finance (DeFi) platforms. Moreover, regulatory support and growing awareness about the benefits of blockchain technology have further accelerated its adoption in the fintech industry.
Global FinTech Blockchain Market Trends
Market Drivers
- Increasing demand for digital payments and transactions
- Growing adoption of decentralized finance (DeFi) solutions
- Rising investments in blockchain technology by financial institutions
- Advancements in artificial intelligence and machine learning for fintech
- Supportive regulatory environment for fintech and blockchain
Market Restraints
- Regulatory uncertainties and compliance challenges
- Security concerns related to blockchain technology
Market Opportunities
- Expansion of blockchain in trade finance and supply chain management
- Integration of internet of things (IoT) with blockchain for enhanced security
FinTech Blockchain Market Report Coverage
| Market | FinTech Blockchain Market |
| FinTech Blockchain Market Size 2022 | USD 2.2 Billion |
| FinTech Blockchain Market Forecast 2032 | USD 45.9 Billion |
| FinTech Blockchain Market CAGR During 2023 - 2032 | 45.6% |
| FinTech Blockchain Market Analysis Period | 2020 - 2032 |
| Base Year |
2022 |
| Forecast Data | 2023 - 2032 |
| Segments Covered | By Provider, By Application, By Organization Size, By Verticals, And By Geography |
| Regional Scope | North America, Europe, Asia Pacific, Latin America, and Middle East & Africa |
| Key Companies Profiled | AlphaPoint Corporation, Oracle Corporation, Bitfury Group Limited, Digital Asset Holdings LLC, Amazon Web Services, Inc., Circle Internet Financial Limited, Cambridge Blockchain, LLC, Earthport Plc, Accenture Plc, IBM Corporation, Factom, Inc., and Microsoft Corporation. |
| Report Coverage |
Market Trends, Drivers, Restraints, Competitive Analysis, Player Profiling, Covid-19 Analysis, Regulation Analysis |
Fintech blockchain, the amalgamation of financial technology and blockchain technology, represents the innovative use of decentralized digital ledgers for financial services. Traditional financial systems often involve intermediaries like banks, leading to slower transactions, higher costs, and increased complexity. Fintech blockchain addresses these challenges by providing a secure, transparent, and efficient way to conduct financial transactions. Blockchain, as a decentralized ledger, ensures the integrity of data and enhances security, making it an ideal solution for the fintech industry. By leveraging blockchain, fintech companies can create a wide array of applications, ranging from digital wallets and peer-to-peer payments to smart contracts and decentralized lending platforms. These applications empower users by enabling faster, cheaper, and more accessible financial services, disrupting traditional banking models.
The fintech blockchain market has experienced significant growth over the past few years, driven by the increasing adoption of blockchain technology in the financial sector. One of the key factors fueling this growth is the rising demand for efficient and secure digital financial services. Traditional financial systems often suffer from inefficiencies, high transaction costs, and lengthy processing times. Blockchain technology addresses these issues by providing a decentralized and transparent ledger system, enabling faster, cheaper, and more secure transactions. Furthermore, the increasing growth of the blockchain supply chain market further fuels the fintech blockchain market in the coming years. As businesses and consumers alike recognize the potential benefits of blockchain, fintech companies are integrating this technology into their offerings, leading to a surge in innovative solutions for payments, lending, remittances, and other financial services. Additionally, the growth of the blockchain in the fintech market can be attributed to the increasing interest and investments from both established financial institutions and venture capital firms.
FinTech Blockchain Market Segmentation
The global FinTech Blockchain Market segmentation is based on provider, application, organization size, verticals, and geography.
FinTech Blockchain Market By Provider
- Middleware Providers
- Infrastructure and Protocol Providers
- Application and Solution Providers
According to the fintech blockchain industry analysis, the middleware providers segment accounted for the largest market share in 2022. Middleware providers offer software solutions and tools that bridge the gap between the blockchain infrastructure and the applications that run on top of it. These solutions enable interoperability, enhance security, and improve the overall efficiency of fintech services. As the adoption of blockchain technology in the financial sector has accelerated, the demand for middleware solutions has surged. Fintech companies, banks, and financial institutions are increasingly relying on middleware providers to implement blockchain solutions tailored to their specific needs, whether it's for payment processing, smart contracts, or trade finance. One of the primary factors driving the growth of middleware providers in the blockchain in the fintech market is the need for standardized and scalable solutions.
FinTech Blockchain Market By Application
- Payments, Clearing, and Settlement
- Smart Contract
- Exchanges and Remittance
- Compliance Management/ KYC
- Identity Management
- Other
In terms of applications, the payments, clearing, and settlement segment is expected to witness significant growth in the coming years. Blockchain technology offers a decentralized and transparent ledger system that significantly improves the efficiency and security of payment processes. Fintech companies and financial institutions are increasingly adopting blockchain solutions for payments, clearing, and settlement services due to their ability to streamline operations, reduce costs, mitigate fraud, and enhance transaction speed. By utilizing smart contracts and decentralized ledgers, blockchain enables real-time settlement and ensures the immutability and traceability of transactions, making it an ideal solution for payment and settlement systems. One of the primary drivers of growth in this segment is the demand for faster and more secure cross-border transactions.
FinTech Blockchain Market By Organization Size
- Large Enterprises
- SMEs
According to the fintech blockchain market forecast, the SMEs segment is expected to witness significant growth in the coming years. Blockchain technology offers SMEs numerous advantages, including increased efficiency, enhanced security, reduced operational costs, and improved access to financial services. One of the key factors driving the growth in this segment is the ability of blockchain to provide SMEs with affordable and accessible financial solutions, enabling them to overcome traditional barriers such as limited access to credit and costly payment processing systems. Blockchain-powered platforms offer SMEs efficient payment solutions, streamlined supply chain management, and transparent transaction tracking, empowering them to compete more effectively in the global market. Furthermore, the rise of blockchain-based crowdfunding and peer-to-peer lending platforms has opened up new avenues of funding for SMEs.
FinTech Blockchain Market By Verticals
- Banking
- Insurance
- Non-Banking Financial Services
Based on the verticals, the banking segment is expected to continue its growth trajectory in the coming years. Blockchain technology has found various applications in banking, including cross-border payments, trade finance, identity verification, and smart contracts. One of the key drivers of growth in this segment is the need for faster and more secure transactions. Traditional banking systems often involve multiple intermediaries, leading to delays and increased costs. Blockchain technology, with its decentralized and transparent nature, enables real-time settlement and significantly reduces transaction times, making it an attractive solution for both domestic and international payments. Moreover, blockchain technology enhances security and reduces fraud in the banking sector.
FinTech Blockchain Market Regional Outlook
North America
- U.S.
- Canada
Europe
- U.K.
- Germany
- France
- Spain
- Rest of Europe
Asia-Pacific
- India
- Japan
- China
- Australia
- South Korea
- Rest of Asia-Pacific
Latin America
- Brazil
- Mexico
- Rest of Latin America
The Middle East & Africa
- South Africa
- GCC Countries
- Rest of the Middle East & Africa (ME&A)
FinTech Blockchain Market Regional Analysis
Geographically, North America dominate the fintech blockchain market in 2022. This growth can be attributed to a combination of factors that have created a favorable ecosystem for the growth of blockchain technology in the financial sector. One of the key factors is the presence of a robust and advanced financial infrastructure. North America, particularly the United States, has a well-established financial system with a high level of technological adoption. This foundation provides a conducive environment for the integration of blockchain solutions into existing financial services, allowing for seamless innovation and implementation. The region's financial institutions and regulatory bodies have shown openness to exploring blockchain applications, fostering a culture of experimentation and investment in fintech startups. Additionally, North America boasts a thriving startup ecosystem and a significant number of technology hubs, such as Silicon Valley, that attract entrepreneurs, developers, and investors from around the world. These hubs serve as hotbeds for fintech and blockchain innovation, where startups and established companies collaborate, develop new technologies, and drive market growth. Access to venture capital funding is also a crucial factor. North America attracts substantial investments in fintech and blockchain startups, providing the necessary financial resources for research, development, and market expansion. These investments fuel the development of cutting-edge blockchain solutions, leading to a competitive edge in the global market.
FinTech Blockchain Market Player
Some of the top fintech blockchain market companies offered in the professional report include AlphaPoint Corporation, Oracle Corporation, Bitfury Group Limited, Digital Asset Holdings LLC, Amazon Web Services, Inc., Circle Internet Financial Limited, Cambridge Blockchain, LLC, Earthport Plc, Accenture Plc, IBM Corporation, Factom, Inc., and Microsoft Corporation.
Frequently Asked Questions
The market size of fintech blockchain was USD 2.2 Billion in 2022.
The CAGR of fintech blockchain is 45.6% during the analysis period of 2023 to 2032.
The key players operating in the global market are including AlphaPoint Corporation, Oracle Corporation, Bitfury Group Limited, Digital Asset Holdings LLC, Amazon Web Services, Inc., Circle Internet Financial Limited, Cambridge Blockchain, LLC, Earthport Plc, Accenture Plc, IBM Corporation, Factom, Inc., and Microsoft Corporation.
North America held the dominating position in fintech blockchain industry during the analysis period of 2023 to 2032.
Asia-Pacific region exhibited fastest growing CAGR for market of fintech blockchain during the analysis period of 2023 to 2032.
The current trends and dynamics in the fintech blockchain industry include increasing demand for digital payments and transactions, growing adoption of decentralized finance (DeFi) solutions, and advancements in artificial intelligence and machine learning for fintech.
The payments, clearing, and settlement application held the maximum share of the fintech blockchain industry.


