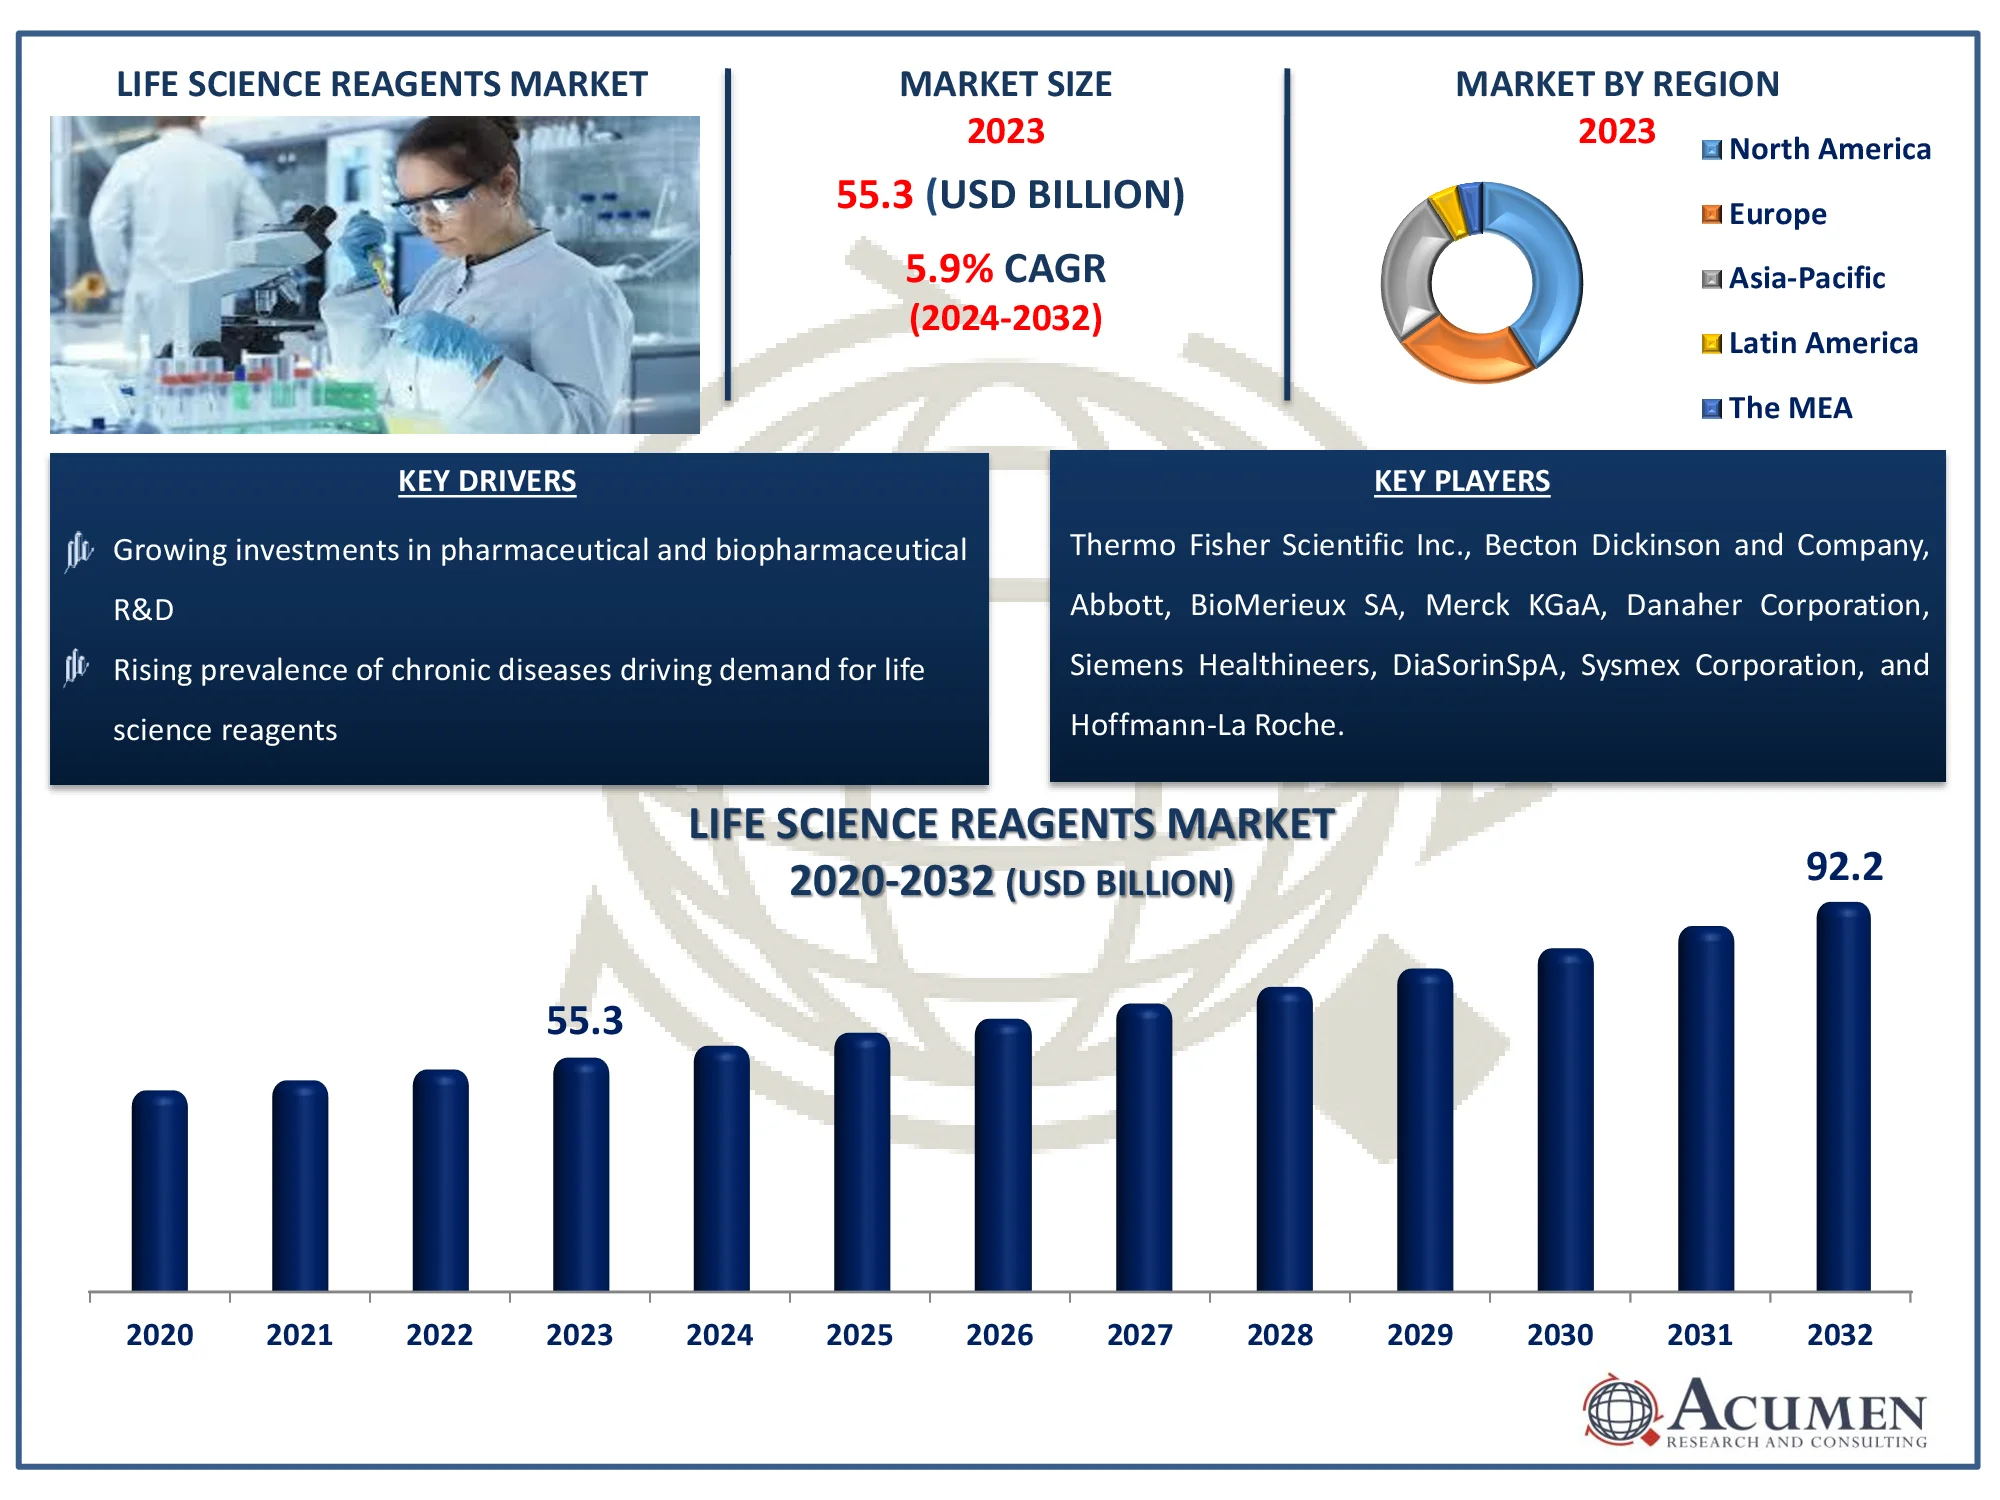
According to Acumen Research and Consulting, the global Life Science Reagents market is expected to grow at noteworthy CAGR around 7.4 % throughout the forecast period and reach around US$ 69 billion by 2026.
The study of life sciences and organisms such as microorganisms, crops, livestock and human beings is known as life science reagents. Following the completion of the human genome project, a fresh age of scientific progress has joined life science studies. As biology stays the centerpiece of life-science, technological developments in bioinformatics, genomics and proteomics have triggered fast development in specializations and interdisciplines.
The report provides analysis of global Life Science Reagents market for the period 2015-2026, wherein 2019 to 2026 is the forecast period and 2018 is considered as the base year.
Market Insights
In latest times, the health care sector has advanced with important breakthroughs driven by the changing patient paradigms from therapy to wellness. With' early diagnosis' as the new standard in the medical sector, the development of efficient cures is highly crucial for tackling the growing number and sequelae of viral epidemics and for reducing patient death rates.
In light of this trend, producers of life science reagents are aiming at developing assessment tools that lower the time for diagnosis and promote early assessment of different illnesses. Patient diagnostic centers such as hospitals or homes are discovered to be far beyond laboratory diagnostics if they have the option of choosing their preferred diagnosis centers. In its latest research, ARC assesses the life science market of reagents in the context of microscopy, gaining insight into how market growth is likely for the future and providing users with practical understanding.
Virus outbreaks and increased chronic diseases require efficient testing in medical specialties and early diagnostic care centres. Medical organizations that seek alternatives to enhance patients ' life expectancy are reactive to life science reactives and require sophisticated testing tools. Having a patient receiving adequate post-diagnostic therapy, life science reagent companies work under pressure to create timely and cost-effective tests to substantially enhance the mortality rate. The sales of life-science reagents increased to around US$ 35,000 million in 2018, driven by their growing applications.
In hospitals and diagnostic laboratories the adoption of life science reagents has increased while rapid growth in biopharmaceutical industry and the research institutions is likely in the foreseeable future to maintain the pace of the market for life science reagents. ARC expects to grow the CAGR market in life sciences by almost 7.4 percent in 2019-2026.
Segmentation Outlook
Due to the widespread use of these tools in diagnosing different illnesses, hospitals and diagnostic laboratories continue to be the extremely profitable end-use segment, holding almost 3/5 of the life sciences reagents market share. However, in latest times, companies of business and contract studies have increasingly used life science reagents for testing the efficiency of biopharmaceuticals.
The effectiveness of their analyses is the key to encouraging sales, which has boosted research and development operations in the landscape of life science reagents only in order to develop technologies. This is recognized by the manufacturers of life science reagents.
The main players are focused on increasing the specificities of immunoassay reagents, which remains the segment's preferred product in order to satisfy demands for extremely sensitive, easy to use and accurate methods from hospitals and pathologies. In addition to hospitals, the pharmaceutical and biotechnology sectors leverage the immunoassay reagents ' ability to promote clinical research and growth, drug discovery and creation of new tests.
However, since the mostly disregarded insurance companies are financially supportive of diagnostic exams involving the use of life science reagents, reimbursement for in-vitro diagnostic exams was small and varied according to end customer status, i.e. hospitals, research institute, etc. Further, the channel for launch of products in the life science reagents has been reduced by rigorous quality filters set by the regulatory organizations to screen health products.
Market Outlook
As analytical tools that provide early diagnosis continue to draw medical agencies ' attention, companies are trying to develop skilled products that diagnose viral structural alterations. A player expands its product portfolio with its internal research and development operations in order to address the particular demands from hospitals, research institutes and the biopharmaceutical sectors. In addition, purchases and combinations were a frequent element of the market for life science reagents, reaching an increasing number of end customers.
In developing countries and on the basis of proven healthcare infrastructures and increasing consumer confidence in sophisticated methods the use of vitro diagnostic methods is remarkably high. Departmental regulations call on private players to create investment to enjoy the gainful chance. However, developed countries are emerging as lucrative areas in the market of life sciences reagents. The elevated rate of infectious diseases and unattended patients in turn contribute to these regions ' profitability.
Strengthening their position and strengthening their supplies in many sections of end-use use, such as medical and biopharmaceutical firms are the key players operating on the life sciences reagents market. DiaSorin S.p. A., for instance, announced in January 2018 a strategic partnership with QIAGEN N.V. to add a QuantiFERON TB diagnostic test to its product family.
Regional Stance
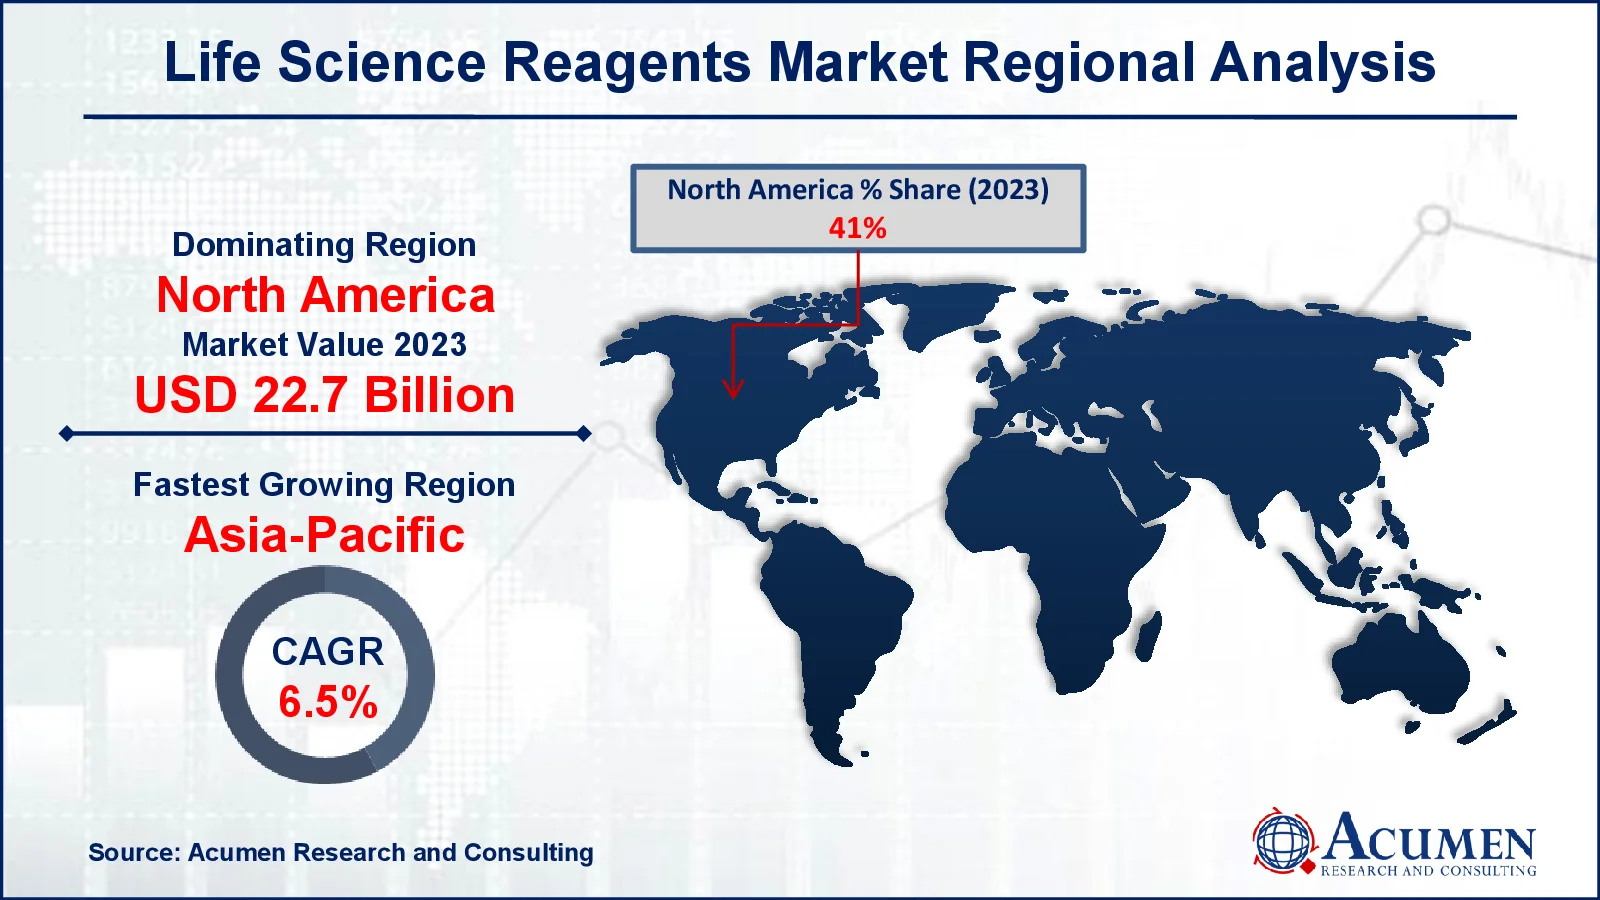
Geographically, the world market for life sciences reagents is divided into five main areas: North America, Europe, Asia Pacific, Latin America, and the Middle East & Africa. America, followed by Europe, dominated the world market for life sciences reagents in 2018. Due to elevated research and development operations in the region, the region accounted for a large proportion of the world life sciences market in 2018.
The Asia Pacific life science market will grow from 2019 to 2026 at a high level of CAGR. The rise in healthcare expenditures and big patient populations, in particular in nations like India and China, in the region can be ascribed to this.
Market Segmentation
Global Life Science Reagents Market, By Product
- Molecular Diagnostic
- Chromatography
- Flow Cytometry
- Cell & Tissue Culture
- Microbiology
- Immunoassay
- Clinical Chemistry
- Hematology & Hemostasis
- Others
Global Life Science Reagents Market, By End User
- Commercial
- Hospitals & Diagnostics Laboratories
- Research Institutes
- Others
Global Life Science Reagents Market, By Geography
- North America.
- Europe
- Asia-Pacific
- Latin America
- Middle East and Africa (MEA)
The market research study on “Life Science Reagents Market - Global Industry Analysis, Market Size, Opportunities and Forecast, 2019 - 2026” offers detailed insights on global Life Science Reagents market segments with market dynamics and their impact. The report also covers basic technology development policies.
Key Players & Strategies
The market of life science reagents is divided and the intensity of competition in the landscape is increasing. The market is extremely controlled by the top actors –F. Hoffmann-La Roche, Abbott, Thermo Fisher Scientific, Inc. Both organic and inorganic approaches are employed by these firms for their place on the market for life sciences reagents. As their organic growth policies, research and development have provided them with the focus for the diversification of their product portfolios. Other players are Beckman Coulter, Inc, Agilent Technologies, Inc., Bio-Rad Laboratories, Inc., BD, bioMérieux SA, Merck KGaA, PerkinElmer Inc., Lonza Bioscience, more.
However, Local players concentrate on providing their international competitors relative cost-effective products. The product offering has helped local players with a widespread supply network in many geographies at comparatively reduced prices than average selling prices. The availability of products at competitive rates has pressured top players, which intensifies competition in the landscape of life sciences.
CHAPTER 1. INDUSTRY OVERVIEW
1.1. Definition and Scope
1.1.1. Definition of Life Science Reagents
1.1.2. Market Segmentation
1.1.3. List of Abbreviations
1.2. Summary
1.2.1. Market Snapshot
1.2.2. Life Science Reagents Market By Product
1.2.2.1. Global Life Science Reagents Market Revenue and Growth Rate Comparison By Product (2015-2026)
1.2.2.2. Global Life Science Reagents Market Revenue Share By Product in 2017
1.2.2.3. Molecular Diagnostic
1.2.2.4. Chromatography
1.2.2.5. Flow Cytometry
1.2.2.6. Cell & Tissue Culture
1.2.2.7. Microbiology
1.2.2.8. Immunoassay
1.2.2.9. Clinical Chemistry
1.2.2.10. Hematology & Hemostasis
1.2.2.11. Others
1.2.3. Life Science Reagents Market By End User
1.2.3.1. Global Life Science Reagents Market Revenue and Growth Rate Comparison By End User (2015-2026)
1.2.3.2. Global Life Science Reagents Market Revenue Share By End User in 2017
1.2.3.3. Commercial
1.2.3.4. Hospitals & Diagnostics Laboratories
1.2.3.5. Research Institutes
1.2.3.6. Others
1.2.4. Life Science Reagents Market by Geography
1.2.4.1. Global Life Science Reagents Market Revenue and Growth Rate Comparison by Geography (2015-2026)
1.2.4.2. North America Life Science Reagents Market Revenue and Growth Rate (2015-2026)
1.2.4.3. Europe Life Science Reagents Market Revenue and Growth Rate (2015-2026)
1.2.4.4. Asia-Pacific Life Science Reagents Market Revenue and Growth Rate (2015-2026)
1.2.4.5. Latin America Life Science Reagents Market Revenue and Growth Rate (2015-2026)
1.2.4.6. Middle East and Africa (MEA) Life Science Reagents Market Revenue and Growth Rate (2015-2026)
CHAPTER 2. MARKET DYNAMICS AND COMPETITION ANALYSIS
2.1. Market Drivers
2.2. Restraints and Challenges
2.3. Growth Opportunities
2.4. Porter’s Five Forces Analysis
2.4.1. Bargaining Power of Suppliers
2.4.2. Bargaining Power of Buyers
2.4.3. Threat of Substitute
2.4.4. Threat of New Entrants
2.4.5. Degree of Competition
2.5. Value Chain Analysis
2.6. Cost Structure Analysis
2.6.1. Raw Material and Suppliers
2.6.2. Manufacturing Process Analysis
2.7. Regulatory Compliance
2.8. Competitive Landscape, 2017
2.8.1. Player Positioning Analysis
2.8.2. Key Strategies Adopted By Leading Players
CHAPTER 3. MANUFACTURING PLANTS ANALYSIS
3.1. Capacity and Commercial Production Date of Global Life Science Reagents Major Manufacturers in 2017
3.2. Manufacturing Plants Distribution of Global Life Science Reagents Major Manufacturers in 2017
3.3. R&D Status and Technology Source of Global Life Science Reagents Major Manufacturers in 2017
3.4. Raw Materials Sources Analysis of Global Life Science Reagents Major Manufacturers in 2017
CHAPTER 4. LIFE SCIENCE REAGENTS MARKET BY PRODUCT
4.1. Global Life Science Reagents Revenue By Product
4.2. Molecular Diagnostic
4.2.1. Market Revenue and Growth Rate, 2015 - 2026 ($Million)
4.2.2. Market Revenue and Forecast, By Region, 2015 - 2026 ($Million)
4.3. Chromatography
4.3.1. Market Revenue and Growth Rate, 2015 - 2026 ($Million)
4.3.2. Market Revenue and Forecast, By Region, 2015 - 2026 ($Million)
4.4. Flow Cytometry
4.4.1. Market Revenue and Growth Rate, 2015 - 2026 ($Million)
4.4.2. Market Revenue and Forecast, By Region, 2015 - 2026 ($Million)
4.5. Cell & Tissue Culture
4.5.1. Market Revenue and Growth Rate, 2015 - 2026 ($Million)
4.5.2. Market Revenue and Forecast, By Region, 2015 - 2026 ($Million)
4.6. Microbiology
4.6.1. Market Revenue and Growth Rate, 2015 - 2026 ($Million)
4.6.2. Market Revenue and Forecast, By Region, 2015 - 2026 ($Million)
4.7. Immunoassay
4.7.1. Market Revenue and Growth Rate, 2015 - 2026 ($Million)
4.7.2. Market Revenue and Forecast, By Region, 2015 - 2026 ($Million)
4.8. Clinical Chemistry
4.8.1. Market Revenue and Growth Rate, 2015 - 2026 ($Million)
4.8.2. Market Revenue and Forecast, By Region, 2015 - 2026 ($Million)
4.9. Hematology & Hemostasis
4.9.1. Market Revenue and Growth Rate, 2015 - 2026 ($Million)
4.9.2. Market Revenue and Forecast, By Region, 2015 - 2026 ($Million)
4.10. Others
4.10.1. Market Revenue and Growth Rate, 2015 - 2026 ($Million)
4.10.2. Market Revenue and Forecast, By Region, 2015 - 2026 ($Million)
CHAPTER 5. LIFE SCIENCE REAGENTS MARKET BY END USER
5.1. Global Life Science Reagents Revenue By End User
5.2. Commercial
5.2.1. Market Revenue and Growth Rate, 2015 - 2026 ($Million)
5.2.2. Market Revenue and Forecast, By Region, 2015 - 2026 ($Million)
5.3. Hospitals & Diagnostics Laboratories
5.3.1. Market Revenue and Growth Rate, 2015 - 2026 ($Million)
5.3.2. Market Revenue and Forecast, By Region, 2015 - 2026 ($Million)
5.4. Research Institutes
5.4.1. Market Revenue and Growth Rate, 2015 - 2026 ($Million)
5.4.2. Market Revenue and Forecast, By Region, 2015 - 2026 ($Million)
5.5. Others
5.5.1. Market Revenue and Growth Rate, 2015 - 2026 ($Million)
5.5.2. Market Revenue and Forecast, By Region, 2015 - 2026 ($Million)
CHAPTER 6. NORTH AMERICA LIFE SCIENCE REAGENTS MARKET BY COUNTRY
6.1. North America Life Science Reagents Market Revenue and Growth Rate, 2015 - 2026 ($Million)
6.2. North America Life Science Reagents Market Revenue Share Comparison, 2015 & 2026 (%)
6.3. U.S.
6.3.1. U.S. Life Science Reagents Market Revenue and Forecast By Product, 2015 - 2026 ($Million)
6.3.2. Market Revenue and Forecast By End User, 2015 - 2026 ($Million)
6.4. Canada
6.4.1. Market Revenue and Forecast By Product, 2015 - 2026 ($Million)
6.4.2. Market Revenue and Forecast By End User, 2015 - 2026 ($Million)
6.5. Mexico
6.5.1. Market Revenue and Forecast By Product, 2015 - 2026 ($Million)
6.5.2. Market Revenue and Forecast By End User, 2015 - 2026 ($Million)
CHAPTER 7. EUROPE LIFE SCIENCE REAGENTS MARKET BY COUNTRY
7.1. Europe Life Science Reagents Market Revenue and Growth Rate, 2015 - 2026 ($Million)
7.2. Europe Life Science Reagents Market Revenue Share Comparison, 2015 & 2026 (%)
7.3. UK
7.3.1. Market Revenue and Forecast By Product, 2015 - 2026 ($Million)
7.3.2. Market Revenue and Forecast By End User, 2015 - 2026 ($Million)
7.4. Germany
7.4.1. Market Revenue and Forecast By Product, 2015 - 2026 ($Million)
7.4.2. Market Revenue and Forecast By End User, 2015 - 2026 ($Million)
7.5. France
7.5.1. Market Revenue and Forecast By Product, 2015 - 2026 ($Million)
7.5.2. Market Revenue and Forecast By End User, 2015 - 2026 ($Million)
7.6. Spain
7.6.1. Market Revenue and Forecast By Product, 2015 - 2026 ($Million)
7.6.2. Market Revenue and Forecast By End User, 2015 - 2026 ($Million)
7.7. Rest of Europe
7.7.1. Market Revenue and Forecast By Product, 2015 - 2026 ($Million)
7.7.2. Market Revenue and Forecast By End User, 2015 - 2026 ($Million)
CHAPTER 8. ASIA-PACIFIC LIFE SCIENCE REAGENTS MARKET BY COUNTRY
8.1. Asia-Pacific Life Science Reagents Market Revenue and Growth Rate, 2015 - 2026 ($Million)
8.2. Asia-Pacific Life Science Reagents Market Revenue Share Comparison, 2015 & 2026 (%)
8.3. China
8.3.1. Market Revenue and Forecast By Product, 2015 - 2026 ($Million)
8.3.2. Market Revenue and Forecast By End User, 2015 - 2026 ($Million)
8.4. Japan
8.4.1. Market Revenue and Forecast By Product, 2015 - 2026 ($Million)
8.4.2. Market Revenue and Forecast By End User, 2015 - 2026 ($Million)
8.5. India
8.5.1. Market Revenue and Forecast By Product, 2015 - 2026 ($Million)
8.5.2. Market Revenue and Forecast By End User, 2015 - 2026 ($Million)
8.6. Australia
8.6.1. Market Revenue and Forecast By Product, 2015 - 2026 ($Million)
8.6.2. Market Revenue and Forecast By End User, 2015 - 2026 ($Million)
8.7. South Korea
8.7.1. Market Revenue and Forecast By Product, 2015 - 2026 ($Million)
8.7.2. Market Revenue and Forecast By End User, 2015 - 2026 ($Million)
8.8. Rest of Asia-Pacific
8.8.1. Market Revenue and Forecast By Product, 2015 - 2026 ($Million)
8.8.2. Market Revenue and Forecast By End User, 2015 - 2026 ($Million)
CHAPTER 9. LATIN AMERICA LIFE SCIENCE REAGENTS MARKET BY COUNTRY
9.1. Latin America Life Science Reagents Market Revenue and Growth Rate, 2015 - 2026 ($Million)
9.2. Latin America Life Science Reagents Market Revenue Share Comparison, 2015 & 2026 (%)
9.3. Brazil
9.3.1. Market Revenue and Forecast By Product, 2015 - 2026 ($Million)
9.3.2. Market Revenue and Forecast By End User, 2015 - 2026 ($Million)
9.4. Argentina
9.4.1. Market Revenue and Forecast By Product, 2015 - 2026 ($Million)
9.4.2. Market Revenue and Forecast By End User, 2015 - 2026 ($Million)
9.5. Rest of Latin America
9.5.1. Market Revenue and Forecast By Product, 2015 - 2026 ($Million)
9.5.2. Market Revenue and Forecast By End User, 2015 - 2026 ($Million)
CHAPTER 10. MIDDLE EAST LIFE SCIENCE REAGENTS MARKET BY COUNTRY
10.1. Middle East Life Science Reagents Market Revenue and Growth Rate, 2015 - 2026 ($Million)
10.2. Middle East Life Science Reagents Market Revenue Share Comparison, 2015 & 2026 (%)
10.3. Saudi Arabia
10.3.1. Market Revenue and Forecast By Product, 2015 - 2026 ($Million)
10.3.2. Market Revenue and Forecast By End User, 2015 - 2026 ($Million)
10.4. UAE
10.4.1. Market Revenue and Forecast By Product, 2015 - 2026 ($Million)
10.4.2. Market Revenue and Forecast By End User, 2015 - 2026 ($Million)
10.5. Rest of Middle East
10.5.1. Market Revenue and Forecast By Product, 2015 - 2026 ($Million)
10.5.2. Market Revenue and Forecast By End User, 2015 - 2026 ($Million)
CHAPTER 11. AFRICA LIFE SCIENCE REAGENTS MARKET BY COUNTRY
11.1. Africa Life Science Reagents Market Revenue and Growth Rate, 2015 - 2026 ($Million)
11.2. Africa Life Science Reagents Market Revenue Share Comparison, 2015 & 2026 (%)
11.3. South Africa
11.3.1. Market Revenue and Forecast By Product, 2015 - 2026 ($Million)
11.3.2. Market Revenue and Forecast By End User, 2015 - 2026 ($Million)
11.4. Egypt
11.4.1. Market Revenue and Forecast By Product, 2015 - 2026 ($Million)
11.4.2. Market Revenue and Forecast By End User, 2015 - 2026 ($Million)
11.5. Rest of Africa
11.5.1. Market Revenue and Forecast By Product, 2015 - 2026 ($Million)
11.5.2. Market Revenue and Forecast By End User, 2015 - 2026 ($Million)
CHAPTER 12. COMPANY PROFILE
12.1. F. Hoffmann-La Roche
12.1.1. Company Snapshot
12.1.2. Overview
12.1.3. Financial Overview
12.1.4. Product Portfolio
12.1.5. Key Developments
12.1.6. Strategies
12.2. Abbott
12.2.1. Company Snapshot
12.2.2. Overview
12.2.3. Financial Overview
12.2.4. Product Portfolio
12.2.5. Key Developments
12.2.6. Strategies
12.3. Thermo Fisher Scientific, Inc.
12.3.1. Company Snapshot
12.3.2. Overview
12.3.3. Financial Overview
12.3.4. Product Portfolio
12.3.5. Key Developments
12.3.6. Strategies
12.4. Beckman Coulter, Inc
12.4.1. Company Snapshot
12.4.2. Overview
12.4.3. Financial Overview
12.4.4. Product Portfolio
12.4.5. Key Developments
12.4.6. Strategies
12.5. Agilent Technologies, Inc.
12.5.1. Company Snapshot
12.5.2. Overview
12.5.3. Financial Overview
12.5.4. Product Portfolio
12.5.5. Key Developments
12.5.6. Strategies
12.6. Bio-Rad Laboratories, Inc
12.6.1. Company Snapshot
12.6.2. Overview
12.6.3. Financial Overview
12.6.4. Product Portfolio
12.6.5. Key Developments
12.6.6. Strategies
12.7. BD
12.7.1. Company Snapshot
12.7.2. Overview
12.7.3. Financial Overview
12.7.4. Product Portfolio
12.7.5. Key Developments
12.7.6. Strategies
12.8. bioMérieux SA
12.8.1. Company Snapshot
12.8.2. Overview
12.8.3. Financial Overview
12.8.4. Product Portfolio
12.8.5. Key Developments
12.8.6. Strategies
12.9. Merck KGaA
12.9.1. Company Snapshot
12.9.2. Overview
12.9.3. Financial Overview
12.9.4. Product Portfolio
12.9.5. Key Developments
12.9.6. Strategies
12.10. PerkinElmer Inc.
12.10.1. Company Snapshot
12.10.2. Overview
12.10.3. Financial Overview
12.10.4. Product Portfolio
12.10.5. Key Developments
12.10.6. Strategies
12.11. Lonza Bioscience
12.11.1. Company Snapshot
12.11.2. Overview
12.11.3. Financial Overview
12.11.4. Product Portfolio
12.11.5. Key Developments
12.11.6. Strategies
12.12. Others
12.12.1. Company Snapshot
12.12.2. Overview
12.12.3. Financial Overview
12.12.4. Product Portfolio
12.12.5. Key Developments
12.12.6. Strategies
CHAPTER 13. RESEARCH APPROACH
13.1. Research Methodology
13.1.1. Initial Data Search
13.1.2. Secondary Research
13.1.3. Primary Research
13.2. Assumptions and Scope