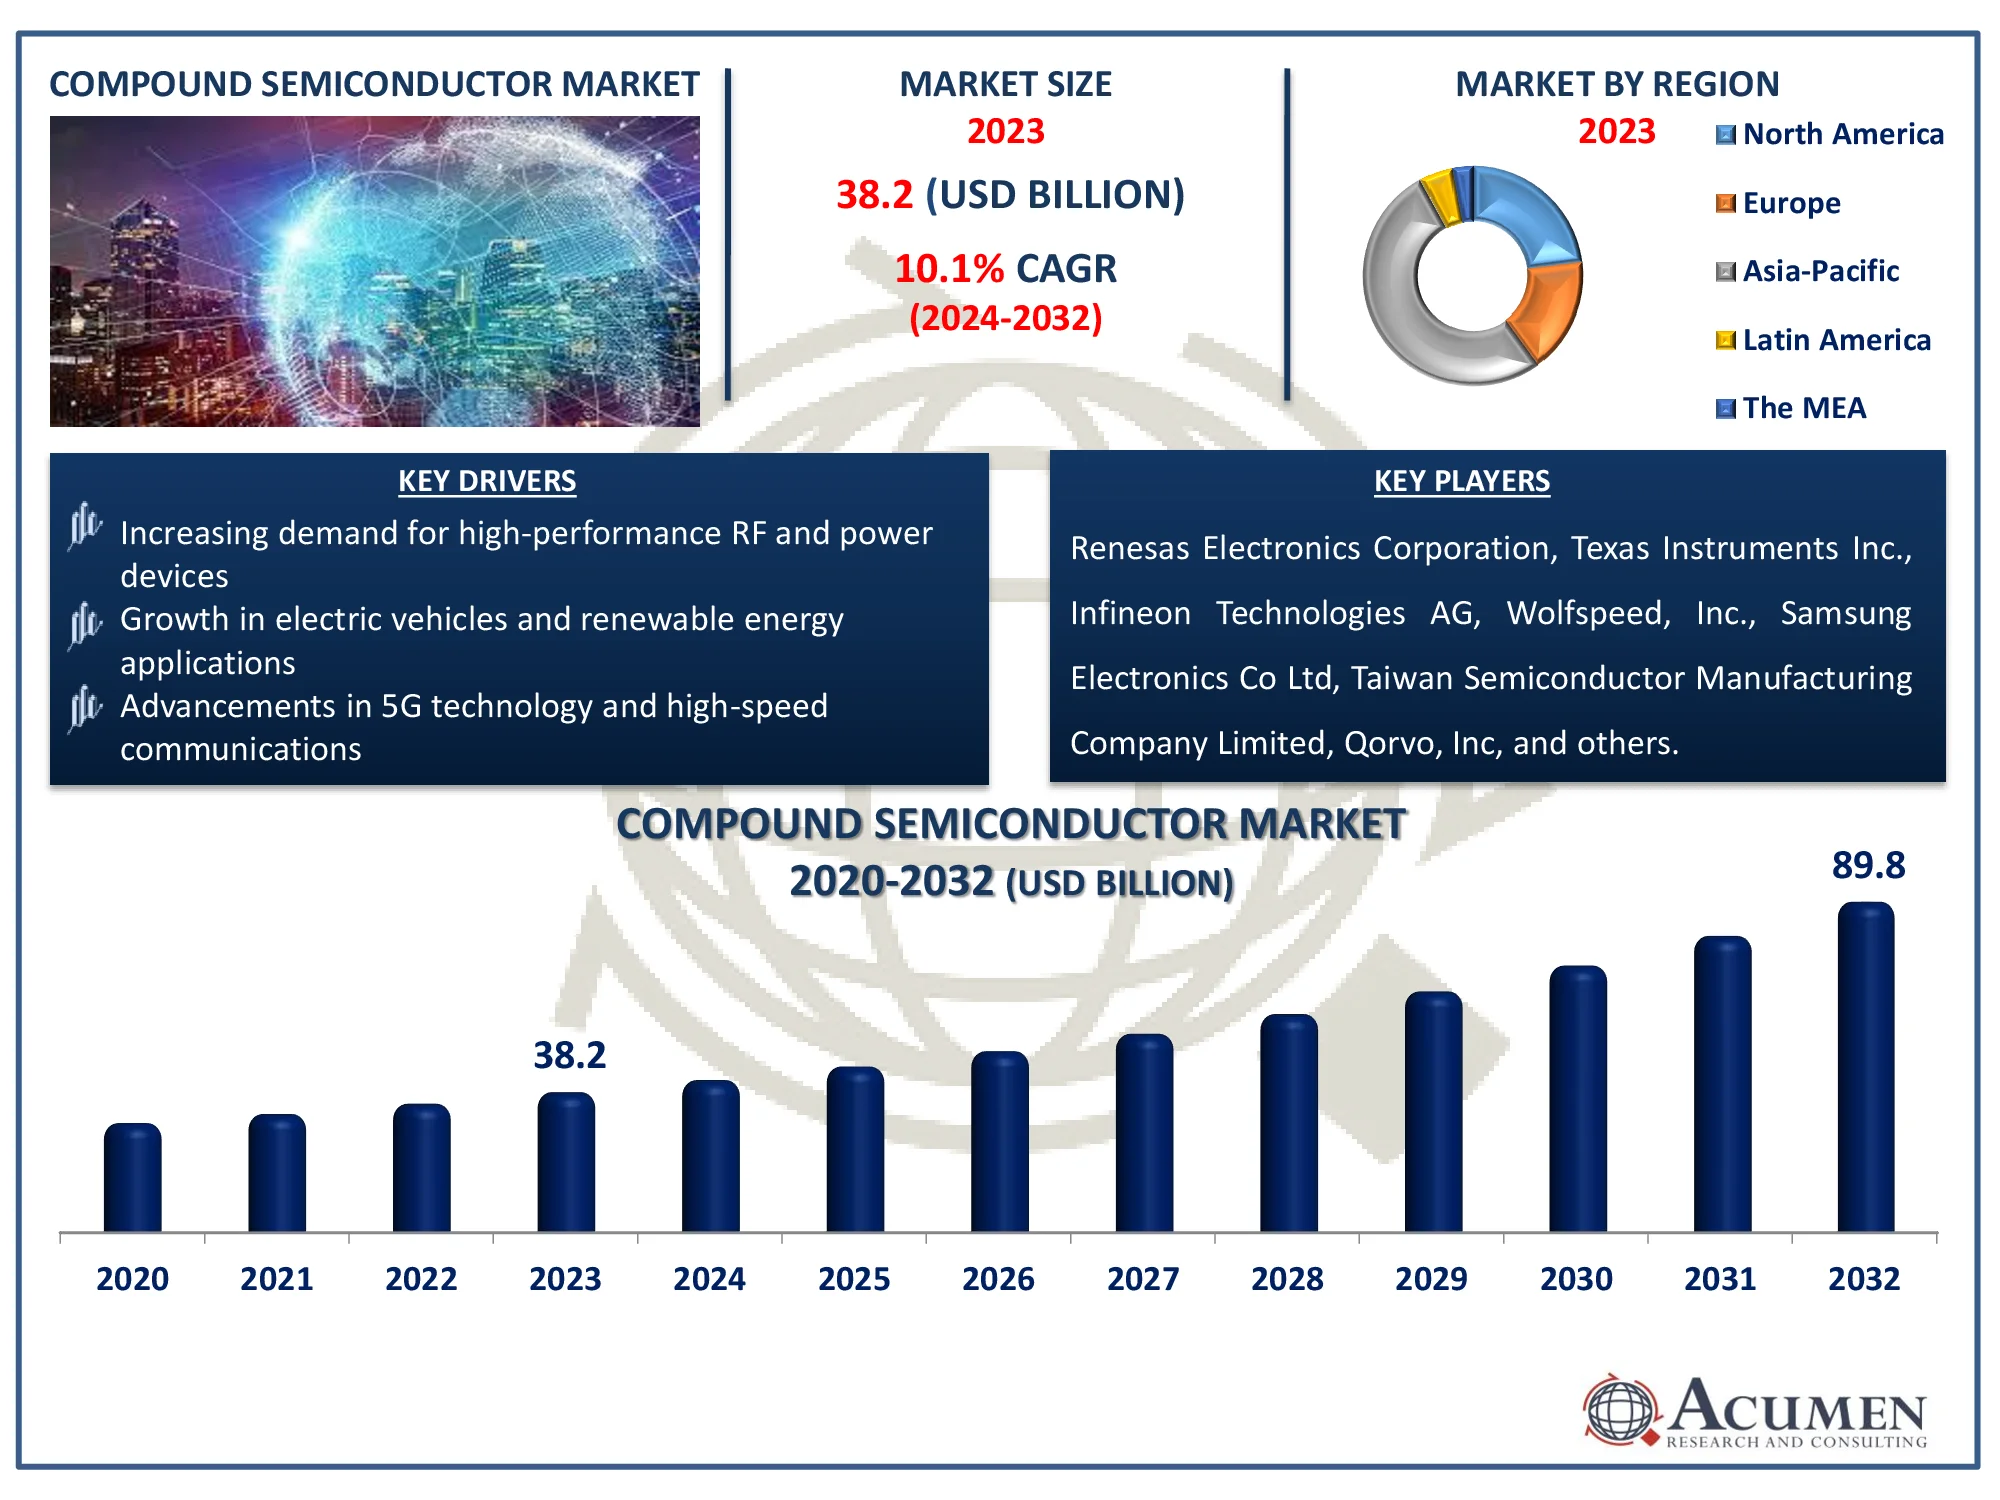
The global compound semiconductor market size is expected to reach USD 55 billion by 2026, at a significant growth rate of 7.1% during the forecasted period 2019 to 2026.
The compound semiconductor is comprises of two or more elements. The compound semiconductor is manufactured using various type of deposition technologies such as atomic layer deposition, chemical vapour deposition among others. They possess wide range of properties such as high band gap and temperature resistance, fast operation, better frequency and optoelectronic features. These benefits are expected to boost the growth of compound semiconductor market over the forecast period as well. Many manufacturers in the compound semiconductor market are focusing on developing customized products for specific applications that are affordable. The compound semiconductor has the ability to consume less power and has high electron mobility, which is also anticipated to boost its demand.
Increasing government support and increase in government and stakeholder funding has led to increase in demand for compound semiconductor systems. In addition to this, the adoption of compound semiconductors in various applications specifically in Led has led to augment in demand for compound semiconductor systems which in turn has driven the compound semiconductor market. In the past few years, there has been a significant increase in adoption of smartphones. This in turn has led to rapid growth in the compound semiconductor market. However, the use of the compound semiconductor has compatibility issues as compared to materials such as silicon. This has proven to be a major restraint for the growth of compound semiconductor market. High fabrication cost is also anticipated to hamper the growth of compound semiconductor market over the forecast period. Increasing awareness pertaining to benefits of using compound semiconductor can bring in new opportunities for the major players in compound semiconductor market.Compound semiconductors have a large application base such as automotive, telecom and energy and power. Growth in these markets is also anticipated to bring in new opportunities in compound semiconductor market. In addition to this, use of compound semiconductors in aerospace, military and defense is also expected to be major opportunity in this market.
Many players have adopted different strategy for the development of the compound semiconductor market. Increasing stakeholders funding is projected to drive the market. For instance, in August 2018, in South wales, the compound semiconductor catapult received a funding of £51.3 million.
The market research study on “Compound semiconductor market - Global Industry Analysis, Market Size, Opportunities and Forecast, 2019 – 2026” offers a detailed outlook, strategic recommendations, and insightful viewpoints on the global compound semiconductor market. The report also analyzes the key players operating in compound semiconductor market and identifies the key strategies deployed by them along with the market share of leading players.
The global compound semiconductor market is segmented as below:
Compound Semiconductor Market by Type
- III-V Compound Semiconductors
- II-VI Compound Semiconductors
- IV-IV Compound Semiconductors
- Sapphire
- Others
Compound Semiconductor Market by Deposition Technology
- Molecular Beam Epitaxy (MBE)
- Chemical Vapor Deposition (CVD)
- Ammonothermal, Hydride Vapor Phase Epitaxy (HVPE)
- Atomic Layer Deposition (ALD)
- Liquid Phase Epitaxy (LPE)
- Others
Compound Semiconductor Market by Product
- Transistors
- Integrated Circuits (ICs)
- Power Semiconductor
- Diodes & Rectifiers
- Others
Compound Semiconductor Market by Application
- Automotive
- Industrial and Energy & Power
- IT & Telecom
- Consumer Electronics
- Aerospace & Defense
- Healthcare
Compound Semiconductor Market by Geography
- North America
- Europe
- UK
- France
- Sweden
- Norway
- Denmark
- Netherlands
- Rest of Europe
- Asia-Pacific
- China
- Japan
- South Korea
- Singapore
- India
- Rest of Asia-Pacific
- Rest of the World
- UAE
- Qatar
- Saudi Arabia
- South Africa
- Rest of the World
The global compound semiconductor market is segmented by type, deposition technology, product, application and region.
On the basis of type, the market is segmented into type (III-V compound semiconductors, II-VI compound semiconductors, IV-IV compound semiconductors, Sapphire, and Others. The IV-IV compound semiconductors are accounted for major share in the compound semiconductor market.
Based on deposition technology, the market is segmented into molecular Beam Epitaxy (MBE), Chemical Vapor Deposition (CVD), Ammonothermal, Hydride Vapor Phase Epitaxy (HVPE), Atomic Layer Deposition (ALD), Liquid Phase Epitaxy (LPE), and others. The CVD segment dominated the global compound semiconductor market. This was mainly attributed to its increased use in consumer electronics, automotive, healthcare among others.
On the basis of products, the global compound semiconductor market is segmented into transistors. Integrated Circuits (ICs), Power Semiconductor, Diodes & rectifiers and others. The power semiconductor segment accounted for larger share in the global compound semiconductor market and is anticipated to hold the major share over the forecast period.
On the basis of application, the market is segmented into automotive, industrial and energy & power, IT & telecom, consumer electronics, aerospace & defense and healthcare. Consumer electronics holds the major share in the global compound semiconductor market and is anticipated to witness the fastest growth till the end of forecast period. In addition to this, the automotive, aerospace and defense is also projected to exhibit the fastest growth over the forecast period.
Regional Segment
Geographically, compound semiconductor market is segmented into North America, Europe, Asia Pacific, Latin America and The Middle East & Africa (LAMEA).
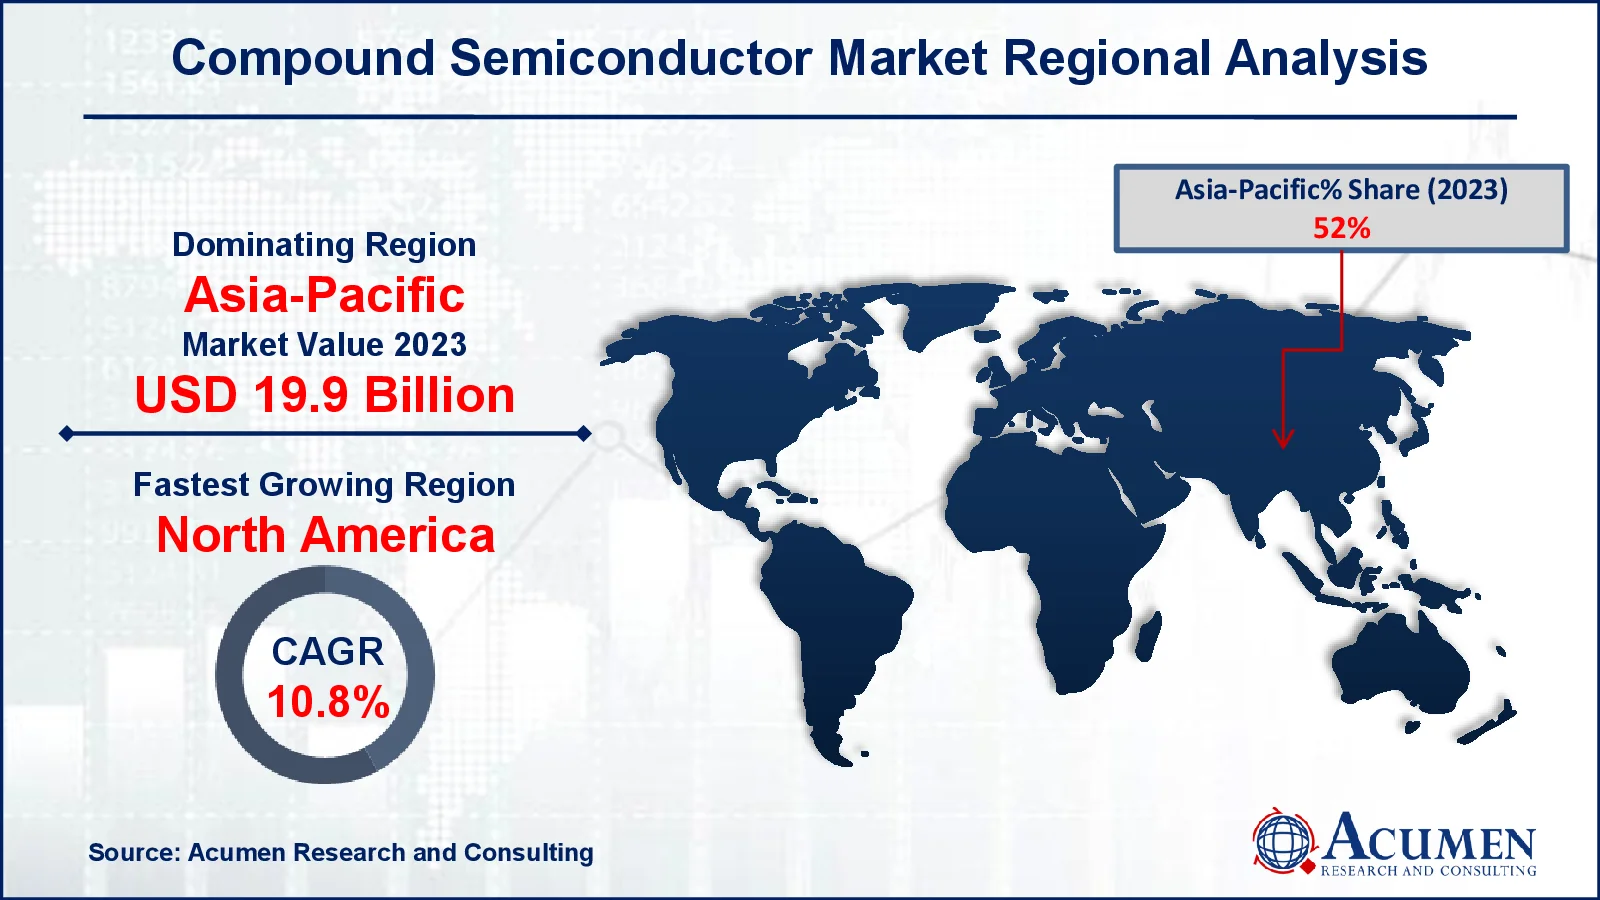
Asia Pacific is one of the leading markets in the global compound semiconductor market across the globe. The major players operating in compound semiconductor market have dominated presence in Asia Pacific region. China and Japan are some of the leading countries in the use of LEDs. Asia Pacific is also anticipated to witness the fastest growth over the forecast period. Countries such as China, South Korea and Japan are also expected to gain major share due to adoption of 5G technology.
North America is also expected to be one of the prominent region in the global compound semiconductor market over the forecast period. Increasing government support and growing expenditure on R&D are projected to drive the compound semiconductor market. France and Germany are the largest contributors to Europe market growth owing to increasing investments in these markets.One of the major reasons for the growth in the market size is the rapid adoption of innovation and technologies in these countries.
However, Latin American and the Middle Eastern countries including Saudi Arabia, United Arab Emirates (UAE), and Kuwait are projected to drive the LAMEA market. On the other hand, Africa is estimated to witness moderate growth in the compound semiconductor market.
Some of the key players in the global compound semiconductor market include Samsung Electronics, Nichia, OSRAM, Cree, Skyworks, GaN, Mitsubishi Electric, ON Semiconductor, Broadcom, and Qurvo. Mergers and acquisitions and product launches are expected to be some of the major strategies adopted by these companies in order to gain larger market shares in compound semiconductor market. For instance, Nichia launched colortunable Chip-on-Board (COB) series general lighting LEDs—NJCWL024Z-V1MT and NVCWJ024Z-V1MT.
CHAPTER 1. INDUSTRY OVERVIEW
1.1. Definition and Scope
1.1.1. Definition of Compound Semiconductor
1.1.2. Market Segmentation
1.1.3. List of Abbreviations
1.2. Summary
1.2.1. Market Snapshot
1.2.2. Compound Semiconductor Market By Type
1.2.2.1. Global Compound Semiconductor Market Revenue and Growth Rate Comparison By Application (2015-2026)
1.2.2.2. Global Compound Semiconductor Market Revenue Share By Application in 2017
1.2.2.3. III-V Compound Semiconductors
1.2.2.4. II-VI Compound Semiconductors
1.2.2.5. IV-IV Compound Semiconductors
1.2.2.6. Sapphire
1.2.2.7. Others
1.2.3. Compound Semiconductor Market By Deposition Technology
1.2.3.1. Global Compound Semiconductor Market Revenue and Growth Rate Comparison By Deposition Technology (2015-2026)
1.2.3.2. Global Compound Semiconductor Market Revenue Share By Deposition Technology in 2017
1.2.3.3. Molecular Beam Epitaxy (MBE)
1.2.3.4. Chemical Vapor Deposition (CVD)
1.2.3.5. Ammonothermal, Hydride Vapor Phase Epitaxy (HVPE)
1.2.3.6. Atomic Layer Deposition (ALD)
1.2.3.7. Liquid Phase Epitaxy (LPE)
1.2.3.8. Others
1.2.4. Compound Semiconductor Market By Product
1.2.4.1. Global Compound Semiconductor Market Revenue and Growth Rate Comparison By Product (2015-2026)
1.2.4.2. Global Compound Semiconductor Market Revenue Share By Product in 2017
1.2.4.3. Transistors
1.2.4.4. Integrated Circuits (ICs)
1.2.4.5. Power Semiconductor
1.2.4.6. Diodes & Rectifiers
1.2.4.7. Others
1.2.5. Compound Semiconductor Market By Application
1.2.5.1. Global Compound Semiconductor Market Revenue and Growth Rate Comparison By Application (2015-2026)
1.2.5.2. Global Compound Semiconductor Market Revenue Share By Application in 2017
1.2.5.3. Automotive
1.2.5.4. Industrial and Energy & Power
1.2.5.5. IT & Telecom
1.2.5.6. Consumer Electronics
1.2.5.7. Aerospace & Defense
1.2.5.8. Healthcare
1.2.6. Compound Semiconductor Market by Geography
1.2.6.1. Global Compound Semiconductor Market Revenue and Growth Rate Comparison by Geography (2015-2026)
1.2.6.2. North America Compound Semiconductor Market Revenue and Growth Rate (2015-2026)
1.2.6.3. Europe Compound Semiconductor Market Revenue and Growth Rate (2015-2026)
1.2.6.4. Asia-Pacific Compound Semiconductor Market Revenue and Growth Rate (2015-2026)
1.2.6.5. Latin America Compound Semiconductor Market Revenue and Growth Rate (2015-2026)
1.2.6.6. Middle East and Africa (MEA) Compound Semiconductor Market Revenue and Growth Rate (2015-2026)
CHAPTER 2. MARKET DYNAMICS AND COMPETITION ANALYSIS
2.1. Market Drivers
2.2. Restraints and Challenges
2.3. Growth Opportunities
2.4. Porter’s Five Forces Analysis
2.4.1. Bargaining Power of Suppliers
2.4.2. Bargaining Power of Buyers
2.4.3. Threat of Substitute
2.4.4. Threat of New Entrants
2.4.5. Degree of Competition
2.5. Value Chain Analysis
2.6. Cost Structure Analysis
2.6.1. Raw Material and Suppliers
2.6.2. Manufacturing Process Analysis
2.7. Regulatory Compliance
2.8. Competitive Landscape, 2017
2.8.1. Player Positioning Analysis
2.8.2. Key Strategies Adopted By Leading Players
CHAPTER 3. MANUFACTURING PLANTS ANALYSIS
3.1. Capacity and Commercial Production Date of Global Compound Semiconductor Major Manufacturers in 2017
3.2. Manufacturing Plants Distribution of Global Compound Semiconductor Major Manufacturers in 2017
3.3. R&D Status and Technology Source of Global Compound Semiconductor Major Manufacturers in 2017
3.4. Raw Materials Sources Analysis of Global Compound Semiconductor Major Manufacturers in 2017
CHAPTER 4. COMPOUND SEMICONDUCTOR MARKET BY TYPE
4.1. Global Compound Semiconductor Revenue By Type
4.2. III-V Compound Semiconductors
4.2.1. Market Revenue and Growth Rate, 2015 - 2026 ($Million)
4.2.2. Market Revenue and Forecast, By Region, 2015 - 2026 ($Million)
4.3. II-VI Compound Semiconductors
4.3.1. Market Revenue and Growth Rate, 2015 - 2026 ($Million)
4.3.2. Market Revenue and Forecast, By Region, 2015 - 2026 ($Million)
4.4. IV-IV Compound Semiconductors
4.4.1. Market Revenue and Growth Rate, 2015 - 2026 ($Million)
4.4.2. Market Revenue and Forecast, By Region, 2015 - 2026 ($Million)
4.5. Sapphire
4.5.1. Market Revenue and Growth Rate, 2015 - 2026 ($Million)
4.5.2. Market Revenue and Forecast, By Region, 2015 - 2026 ($Million)
4.6. Others
4.6.1. Market Revenue and Growth Rate, 2015 - 2026 ($Million)
4.6.2. Market Revenue and Forecast, By Region, 2015 - 2026 ($Million)
CHAPTER 5. COMPOUND SEMICONDUCTOR MARKET BY DEPOSITION TECHNOLOGY
5.1. Global Compound Semiconductor Revenue By Deposition Technology
5.2. Molecular Beam Epitaxy (MBE)
5.2.1. Market Revenue and Growth Rate, 2015 - 2026 ($Million)
5.2.2. Market Revenue and Forecast, By Region, 2015 - 2026 ($Million)
5.3. Chemical Vapor Deposition (CVD)
5.3.1. Market Revenue and Growth Rate, 2015 - 2026 ($Million)
5.3.2. Market Revenue and Forecast, By Region, 2015 - 2026 ($Million)
5.4. Ammonothermal, Hydride Vapor Phase Epitaxy (HVPE)
5.4.1. Market Revenue and Growth Rate, 2015 - 2026 ($Million)
5.4.2. Market Revenue and Forecast, By Region, 2015 - 2026 ($Million)
5.5. Atomic Layer Deposition (ALD)
5.5.1. Market Revenue and Growth Rate, 2015 - 2026 ($Million)
5.5.2. Market Revenue and Forecast, By Region, 2015 - 2026 ($Million)
5.6. Liquid Phase Epitaxy (LPE)
5.6.1. Market Revenue and Growth Rate, 2015 - 2026 ($Million)
5.6.2. Market Revenue and Forecast, By Region, 2015 - 2026 ($Million)
5.7. Others
5.7.1. Market Revenue and Growth Rate, 2015 - 2026 ($Million)
5.7.2. Market Revenue and Forecast, By Region, 2015 - 2026 ($Million)
CHAPTER 6. COMPOUND SEMICONDUCTOR MARKET BY PRODUCT
6.1. Global Compound Semiconductor Revenue By Product
6.2. Transistors
6.2.1. Market Revenue and Growth Rate, 2015 - 2026 ($Million)
6.2.2. Market Revenue and Forecast, By Region, 2015 - 2026 ($Million)
6.3. Integrated Circuits (ICs)
6.3.1. Market Revenue and Growth Rate, 2015 - 2026 ($Million)
6.3.2. Market Revenue and Forecast, By Region, 2015 - 2026 ($Million)
6.4. Power Semiconductor
6.4.1. Market Revenue and Growth Rate, 2015 - 2026 ($Million)
6.4.2. Market Revenue and Forecast, By Region, 2015 - 2026 ($Million)
6.5. Diodes & Rectifiers
6.5.1. Market Revenue and Growth Rate, 2015 - 2026 ($Million)
6.5.2. Market Revenue and Forecast, By Region, 2015 - 2026 ($Million)
6.6. Others
6.6.1. Market Revenue and Growth Rate, 2015 - 2026 ($Million)
6.6.2. Market Revenue and Forecast, By Region, 2015 - 2026 ($Million)
CHAPTER 7. COMPOUND SEMICONDUCTOR MARKET BY APPLICATION
7.1. Global Compound Semiconductor Revenue By Application
7.2. Automotive
7.2.1. Market Revenue and Growth Rate, 2015 - 2026 ($Million)
7.2.2. Market Revenue and Forecast, By Region, 2015 - 2026 ($Million)
7.3. Industrial and Energy & Power
7.3.1. Market Revenue and Growth Rate, 2015 - 2026 ($Million)
7.3.2. Market Revenue and Forecast, By Region, 2015 - 2026 ($Million)
7.4. IT & Telecom
7.4.1. Market Revenue and Growth Rate, 2015 - 2026 ($Million)
7.4.2. Market Revenue and Forecast, By Region, 2015 - 2026 ($Million)
7.5. Consumer Electronics
7.5.1. Market Revenue and Growth Rate, 2015 - 2026 ($Million)
7.5.2. Market Revenue and Forecast, By Region, 2015 - 2026 ($Million)
7.6. Aerospace & Defense
7.6.1. Market Revenue and Growth Rate, 2015 - 2026 ($Million)
7.6.2. Market Revenue and Forecast, By Region, 2015 - 2026 ($Million)
7.7. Healthcare
7.7.1. Market Revenue and Growth Rate, 2015 - 2026 ($Million)
7.7.2. Market Revenue and Forecast, By Region, 2015 - 2026 ($Million)
CHAPTER 8. NORTH AMERICA COMPOUND SEMICONDUCTOR MARKET BY COUNTRY
8.1. North America Compound Semiconductor Market Revenue and Growth Rate, 2015 - 2026 ($Million)
8.2. North America Compound Semiconductor Market Revenue Share Comparison, 2015 & 2026 (%)
8.3. U.S.
8.3.1. Market Revenue and Forecast By Type, 2015 - 2026 ($Million)
8.3.2. Market Revenue and Forecast By Deposition Technology, 2015 - 2026 ($Million)
8.3.3. Market Revenue and Forecast By Product, 2015 - 2026 ($Million)
8.3.4. U.S. Compound Semiconductor Market Revenue and Forecast By Application, 2015 - 2026 ($Million)
8.4. Canada
8.4.1. Market Revenue and Forecast By Type, 2015 - 2026 ($Million)
8.4.2. Market Revenue and Forecast By Deposition Technology, 2015 - 2026 ($Million)
8.4.3. Market Revenue and Forecast By Product, 2015 - 2026 ($Million)
8.4.4. Market Revenue and Forecast By Application, 2015 - 2026 ($Million)
CHAPTER 9. EUROPE COMPOUND SEMICONDUCTOR MARKET BY COUNTRY
9.1. Europe Compound Semiconductor Market Revenue and Growth Rate, 2015 - 2026 ($Million)
9.2. Europe Compound Semiconductor Market Revenue Share Comparison, 2015 & 2026 (%)
9.3. UK
9.3.1. Market Revenue and Forecast By Type, 2015 - 2026 ($Million)
9.3.2. Market Revenue and Forecast By Deposition Technology, 2015 - 2026 ($Million)
9.3.3. Market Revenue and Forecast By Product, 2015 - 2026 ($Million)
9.3.4. Market Revenue and Forecast By Application, 2015 - 2026 ($Million)
9.4. Germany
9.4.1. Market Revenue and Forecast By Type, 2015 - 2026 ($Million)
9.4.2. Market Revenue and Forecast By Deposition Technology, 2015 - 2026 ($Million)
9.4.3. Market Revenue and Forecast By Product, 2015 - 2026 ($Million)
9.4.4. Market Revenue and Forecast By Application, 2015 - 2026 ($Million)
9.5. France
9.5.1. Market Revenue and Forecast By Type, 2015 - 2026 ($Million)
9.5.2. Market Revenue and Forecast By Deposition Technology, 2015 - 2026 ($Million)
9.5.3. Market Revenue and Forecast By Product, 2015 - 2026 ($Million)
9.5.4. Market Revenue and Forecast By Application, 2015 - 2026 ($Million)
9.6. Spain
9.6.1. Market Revenue and Forecast By Type, 2015 - 2026 ($Million)
9.6.2. Market Revenue and Forecast By Deposition Technology, 2015 - 2026 ($Million)
9.6.3. Market Revenue and Forecast By Product, 2015 - 2026 ($Million)
9.6.4. Market Revenue and Forecast By Application, 2015 - 2026 ($Million)
9.7. Rest of Europe
9.7.1. Market Revenue and Forecast By Type, 2015 - 2026 ($Million)
9.7.2. Market Revenue and Forecast By Deposition Technology, 2015 - 2026 ($Million)
9.7.3. Market Revenue and Forecast By Product, 2015 - 2026 ($Million)
9.7.4. Market Revenue and Forecast By Application, 2015 - 2026 ($Million)
CHAPTER 10. ASIA-PACIFIC COMPOUND SEMICONDUCTOR MARKET BY COUNTRY
10.1. Asia-Pacific Compound Semiconductor Market Revenue and Growth Rate, 2015 - 2026 ($Million)
10.2. Asia-Pacific Compound Semiconductor Market Revenue Share Comparison, 2015 & 2026 (%)
10.3. China
10.3.1. Market Revenue and Forecast By Type, 2015 - 2026 ($Million)
10.3.2. Market Revenue and Forecast By Deposition Technology, 2015 - 2026 ($Million)
10.3.3. Market Revenue and Forecast By Product, 2015 - 2026 ($Million)
10.3.4. Market Revenue and Forecast By Application, 2015 - 2026 ($Million)
10.4. Japan
10.4.1. Market Revenue and Forecast By Type, 2015 - 2026 ($Million)
10.4.2. Market Revenue and Forecast By Deposition Technology, 2015 - 2026 ($Million)
10.4.3. Market Revenue and Forecast By Product, 2015 - 2026 ($Million)
10.4.4. Market Revenue and Forecast By Application, 2015 - 2026 ($Million)
10.5. India
10.5.1. Market Revenue and Forecast By Type, 2015 - 2026 ($Million)
10.5.2. Market Revenue and Forecast By Deposition Technology, 2015 - 2026 ($Million)
10.5.3. Market Revenue and Forecast By Product, 2015 - 2026 ($Million)
10.5.4. Market Revenue and Forecast By Application, 2015 - 2026 ($Million)
10.6. Australia
10.6.1. Market Revenue and Forecast By Type, 2015 - 2026 ($Million)
10.6.2. Market Revenue and Forecast By Deposition Technology, 2015 - 2026 ($Million)
10.6.3. Market Revenue and Forecast By Product, 2015 - 2026 ($Million)
10.6.4. Market Revenue and Forecast By Application, 2015 - 2026 ($Million)
10.7. South Korea
10.7.1. Market Revenue and Forecast By Type, 2015 - 2026 ($Million)
10.7.2. Market Revenue and Forecast By Deposition Technology, 2015 - 2026 ($Million)
10.7.3. Market Revenue and Forecast By Product, 2015 - 2026 ($Million)
10.7.4. Market Revenue and Forecast By Application, 2015 - 2026 ($Million)
10.8. Rest of Asia-Pacific
10.8.1. Market Revenue and Forecast By Type, 2015 - 2026 ($Million)
10.8.2. Market Revenue and Forecast By Deposition Technology, 2015 - 2026 ($Million)
10.8.3. Market Revenue and Forecast By Product, 2015 - 2026 ($Million)
10.8.4. Market Revenue and Forecast By Application, 2015 - 2026 ($Million)
CHAPTER 11. LATIN AMERICA COMPOUND SEMICONDUCTOR MARKET BY COUNTRY
11.1. Latin America Compound Semiconductor Market Revenue and Growth Rate, 2015 - 2026 ($Million)
11.2. Latin America Compound Semiconductor Market Revenue Share Comparison, 2015 & 2026 (%)
11.3. Brazil
11.3.1. Market Revenue and Forecast By Type, 2015 - 2026 ($Million)
11.3.2. Market Revenue and Forecast By Deposition Technology, 2015 - 2026 ($Million)
11.3.3. Market Revenue and Forecast By Product, 2015 - 2026 ($Million)
11.3.4. Market Revenue and Forecast By Application, 2015 - 2026 ($Million)
11.4. Mexico
11.4.1. Market Revenue and Forecast By Type, 2015 - 2026 ($Million)
11.4.2. Market Revenue and Forecast By Deposition Technology, 2015 - 2026 ($Million)
11.4.3. Market Revenue and Forecast By Product, 2015 - 2026 ($Million)
11.4.4. Market Revenue and Forecast By Application, 2015 - 2026 ($Million)
11.5. Rest of Latin America
11.5.1. Market Revenue and Forecast By Type, 2015 - 2026 ($Million)
11.5.2. Market Revenue and Forecast By Deposition Technology, 2015 - 2026 ($Million)
11.5.3. Market Revenue and Forecast By Product, 2015 - 2026 ($Million)
11.5.4. Market Revenue and Forecast By Application, 2015 - 2026 ($Million)
CHAPTER 12. MIDDLE EAST COMPOUND SEMICONDUCTOR MARKET BY COUNTRY
12.1. Middle East Compound Semiconductor Market Revenue and Growth Rate, 2015 - 2026 ($Million)
12.2. Middle East Compound Semiconductor Market Revenue Share Comparison, 2015 & 2026 (%)
12.3. Saudi Arabia
12.3.1. Market Revenue and Forecast By Type, 2015 - 2026 ($Million)
12.3.2. Market Revenue and Forecast By Deposition Technology, 2015 - 2026 ($Million)
12.3.3. Market Revenue and Forecast By Product, 2015 - 2026 ($Million)
12.3.4. Market Revenue and Forecast By Application, 2015 - 2026 ($Million)
12.4. UAE
12.4.1. Market Revenue and Forecast By Type, 2015 - 2026 ($Million)
12.4.2. Market Revenue and Forecast By Deposition Technology, 2015 - 2026 ($Million)
12.4.3. Market Revenue and Forecast By Product, 2015 - 2026 ($Million)
12.4.4. Market Revenue and Forecast By Application, 2015 - 2026 ($Million)
12.5. Rest of Middle East
12.5.1. Market Revenue and Forecast By Type, 2015 - 2026 ($Million)
12.5.2. Market Revenue and Forecast By Deposition Technology, 2015 - 2026 ($Million)
12.5.3. Market Revenue and Forecast By Product, 2015 - 2026 ($Million)
12.5.4. Market Revenue and Forecast By Application, 2015 - 2026 ($Million)
CHAPTER 13. AFRICA COMPOUND SEMICONDUCTOR MARKET BY COUNTRY
13.1. Africa Compound Semiconductor Market Revenue and Growth Rate, 2015 - 2026 ($Million)
13.2. Africa Compound Semiconductor Market Revenue Share Comparison, 2015 & 2026 (%)
13.3. South Africa
13.3.1. Market Revenue and Forecast By Type, 2015 - 2026 ($Million)
13.3.2. Market Revenue and Forecast By Deposition Technology, 2015 - 2026 ($Million)
13.3.3. Market Revenue and Forecast By Product, 2015 - 2026 ($Million)
13.3.4. Market Revenue and Forecast By Application, 2015 - 2026 ($Million)
13.4. Egypt
13.4.1. Market Revenue and Forecast By Type, 2015 - 2026 ($Million)
13.4.2. Market Revenue and Forecast By Deposition Technology, 2015 - 2026 ($Million)
13.4.3. Market Revenue and Forecast By Product, 2015 - 2026 ($Million)
13.4.4. Market Revenue and Forecast By Application, 2015 - 2026 ($Million)
13.5. Rest of Africa
13.5.1. Market Revenue and Forecast By Type, 2015 - 2026 ($Million)
13.5.2. Market Revenue and Forecast By Deposition Technology, 2015 - 2026 ($Million)
13.5.3. Market Revenue and Forecast By Product, 2015 - 2026 ($Million)
13.5.4. Market Revenue and Forecast By Application, 2015 - 2026 ($Million)
CHAPTER 14. COMPANY PROFILE
14.1. Samsung Electronics
14.1.1. Company Snapshot
14.1.2. Overview
14.1.3. Financial Overview
14.1.4. Product Portfolio
14.1.5. Key Developments
14.1.6. Strategies
14.2. Nichia
14.2.1. Company Snapshot
14.2.2. Overview
14.2.3. Financial Overview
14.2.4. Product Portfolio
14.2.5. Key Developments
14.2.6. Strategies
14.3. OSRAM
14.3.1. Company Snapshot
14.3.2. Overview
14.3.3. Financial Overview
14.3.4. Product Portfolio
14.3.5. Key Developments
14.3.6. Strategies
14.4. Cree
14.4.1. Company Snapshot
14.4.2. Overview
14.4.3. Financial Overview
14.4.4. Product Portfolio
14.4.5. Key Developments
14.4.6. Strategies
14.5. Skyworks
14.5.1. Company Snapshot
14.5.2. Overview
14.5.3. Financial Overview
14.5.4. Product Portfolio
14.5.5. Key Developments
14.5.6. Strategies
14.6. GaN
14.6.1. Company Snapshot
14.6.2. Overview
14.6.3. Financial Overview
14.6.4. Product Portfolio
14.6.5. Key Developments
14.6.6. Strategies
14.7. Mitsubishi Electric
14.7.1. Company Snapshot
14.7.2. Overview
14.7.3. Financial Overview
14.7.4. Product Portfolio
14.7.5. Key Developments
14.7.6. Strategies
14.8. ON Semiconductor
14.8.1. Company Snapshot
14.8.2. Overview
14.8.3. Financial Overview
14.8.4. Product Portfolio
14.8.5. Key Developments
14.8.6. Strategies
14.9. Broadcom
14.9.1. Company Snapshot
14.9.2. Overview
14.9.3. Financial Overview
14.9.4. Product Portfolio
14.9.5. Key Developments
14.9.6. Strategies
14.10. Qurvo
14.10.1. Company Snapshot
14.10.2. Overview
14.10.3. Financial Overview
14.10.4. Product Portfolio
14.10.5. Key Developments
14.10.6. Strategies
14.11. Others
14.11.1. Company Snapshot
14.11.2. Overview
14.11.3. Financial Overview
14.11.4. Product Portfolio
14.11.5. Key Developments
14.11.6. Strategies
CHAPTER 15. RESEARCH APPROACH
15.1. Research Methodology
15.1.1. Initial Data Search
15.1.2. Secondary Research
15.1.3. Primary Research
15.2. Assumptions and Scope