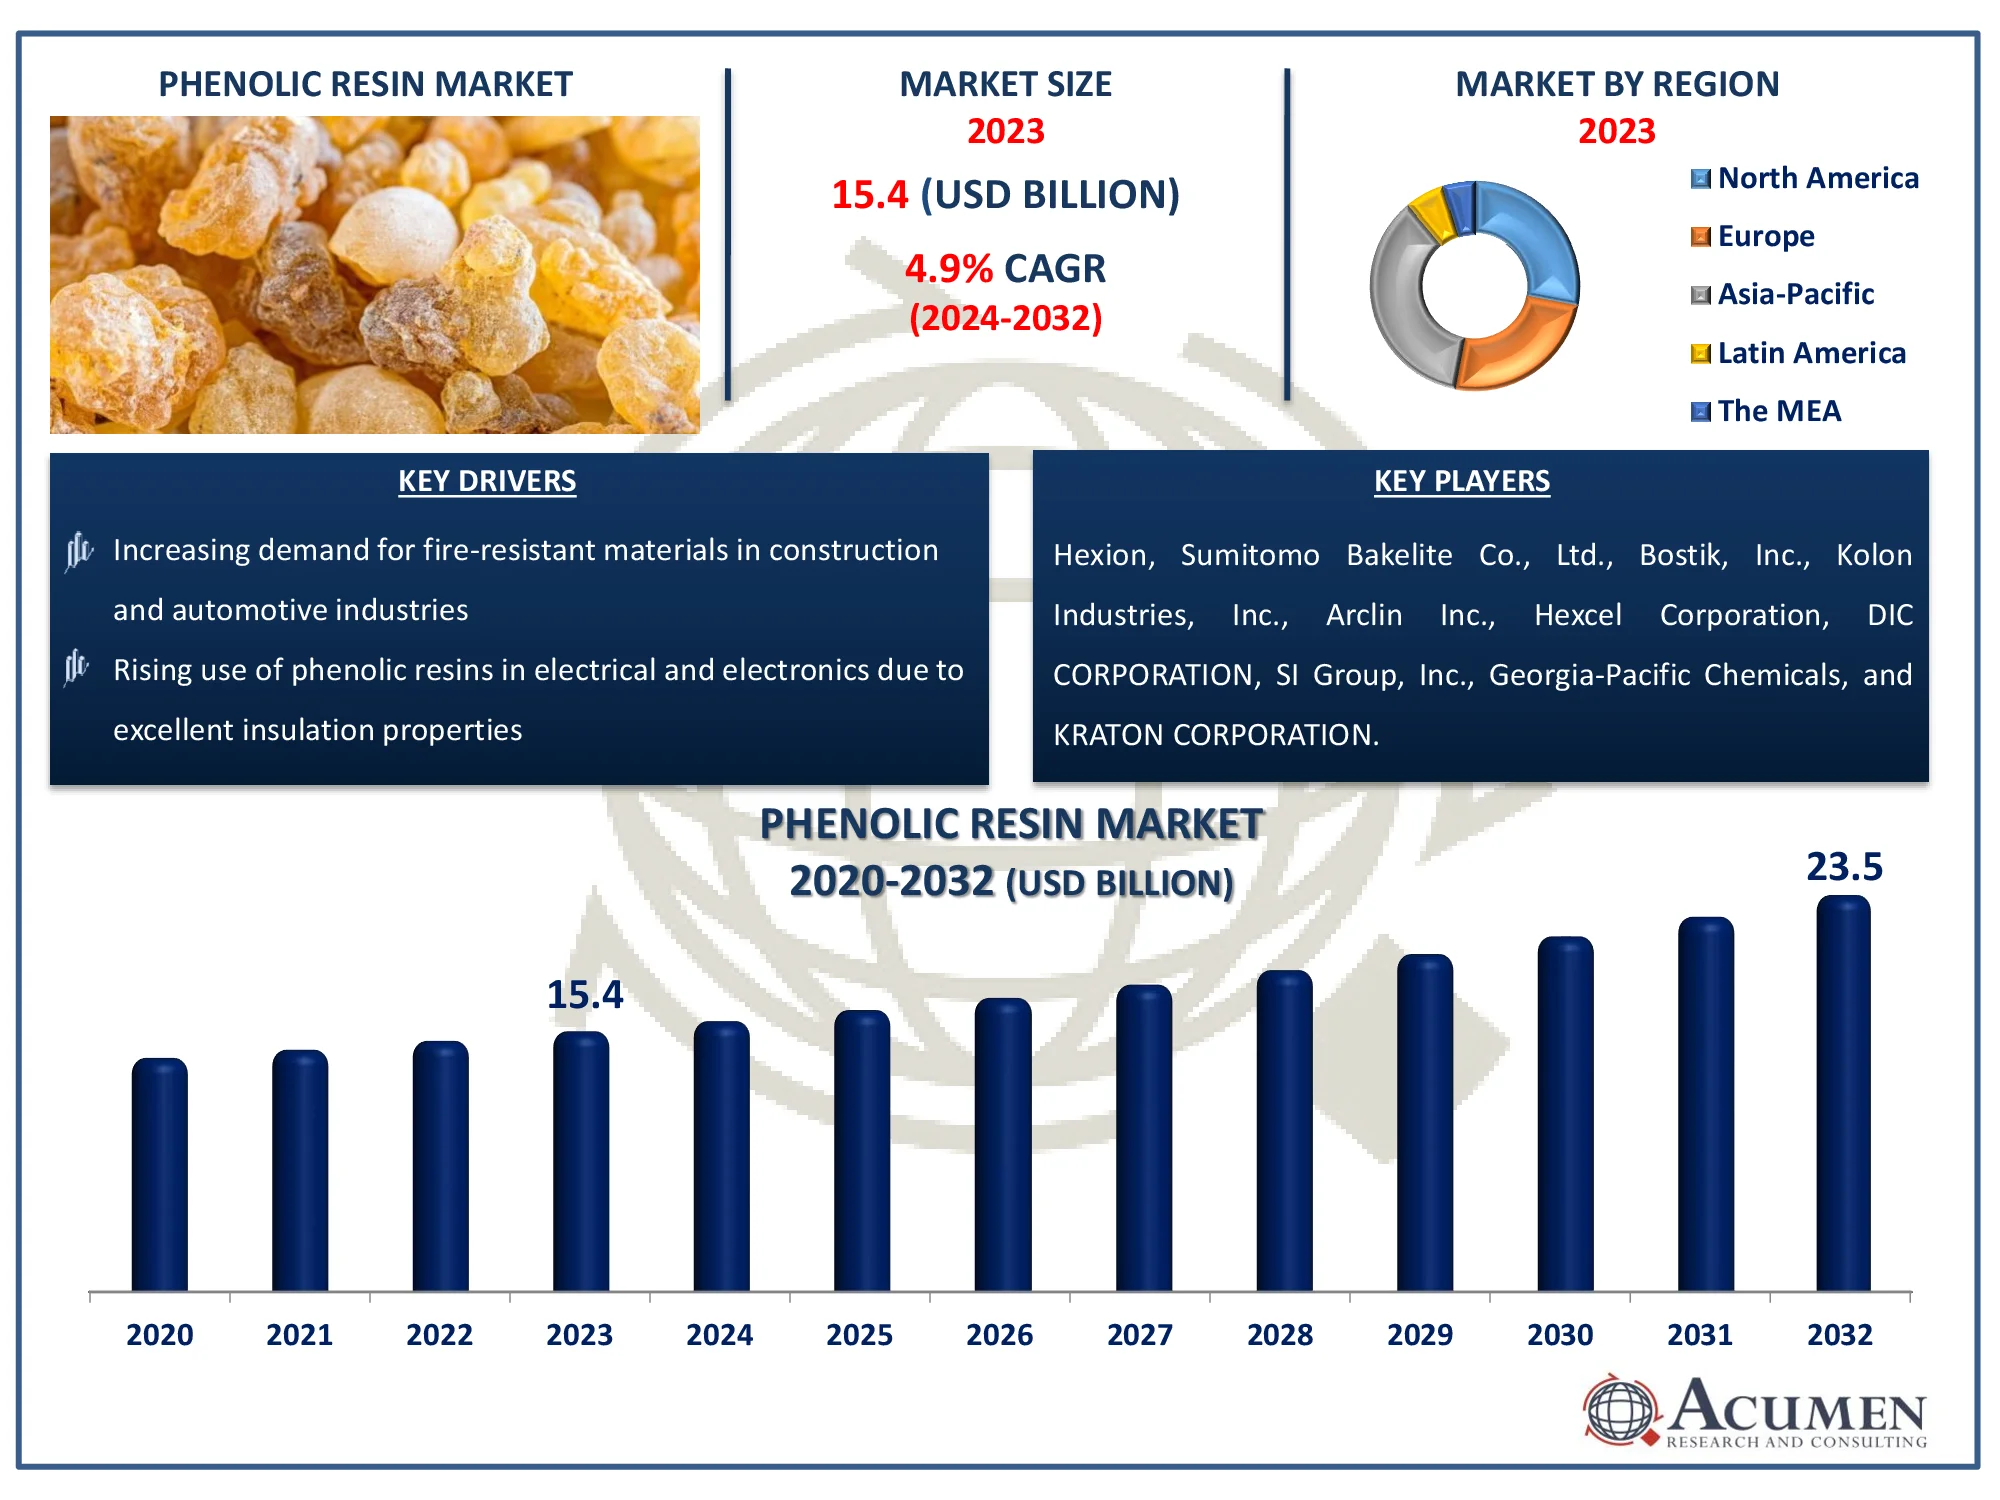
The global phenolic resin market size is expected to reach over USD 15.3 billion by 2026 and will grow at CAGR of 4.8% during the forecast period, 2019-2026.
Phenolic resins are one of the most adaptive materials with diverse application scope having a number of properties such as sustainability, high heat, porosity, flexibility, chemical resistance, and sliding proeperties are anticipated to promote its demand in aerospace, automotive, and construction sectors. Increasing product usage in laminates is expected to be a major growth driver for the phenolic resins market. The global phenolic resin market is heading towards the growth expansion phase of life cycle and is projected to grow significantly during the forecast period. The market is expected to grow at CAGR of 4.8% during the assessment period. Some of the major growth driving factor in this market is cost effective and environmentally free nature of this process, technological advancements in the printing the technologies, and high demand for UV cured inks. Technology momentum has changed the way products are being printed in the packaging industry. This has led to the new product formulation specifically in the packaging printing thereby creating the new growth opportunities. Phenolic Resin is product of technology advancement which has low VOC content and is a eco-friendly that resulting into preference for flexible and colorful packaging with high quality printing ink. It altogether has driving the demand for phenolic resin and contributing significantly in this market. Since the packaging industry is the major consumer of the phenolic resin, high growth for sustainable packaging is boosting the growth of this market. Technological momentum has led to product innovation and which is then launched by major industry players after regular interval has set a growth pattern for phenolic resin market. For instance, Sun chemical introduced new UV based printing on may 2018. Therefore, growth projections are anticipated taking into account the technology momentum. On the other hand, strong penetration of digitalization in the publishing industry driven by trend for e-commerce restraining the growth of this market. This factor further anticipated to further restrain the growth of this market due to high adoption of e-commerce. However, high adoption of water based flexographic inks expected to offer new growth opportunities due to its environmentally free nature.
The market research study on “Phenolic Resin Market - Global Industry Analysis, Market Size, Opportunities and Forecast, 2019 - 2026” offers a detailed outlook, strategic recommendations, and insightful viewpoints on the global Phenolic Resin market. The report also analyzes the key players operating in Phenolic Resin market and identifies the key strategies deployed by them along with the market share of leading players.
The global Phenolic Resin market is segmented as below:
Phenolic Resin Market By Type
- Novolac Resin
- Resol Resin
- Others
Phenolic Resin Market By Application
- Wood Adhesives
- Insulation
- Coatings
- Laminates
- Paper Impregnation
- Foundry
- Molding Compound
- Others
Phenolic Resin Market By End User
- Automotive
- Furniture
- Electrical & Electronics
- Building & Construction
- Industrial
- Others
Phenolic Resin Market By Geography
- North America
- Europe
- UK
- France
- Sweden
- Norway
- Denmark
- Netherlands
- Rest of Europe
- Asia-Pacific
- China
- Japan
- South Korea
- Singapore
- India
- Rest of Asia-Pacific
- Rest of the World
- UAE
- Qatar
- Saudi Arabia
- South Africa
- Rest of the World
The global phenolic resin market is segmented by type, Application, and region.
On the basis of type, the market is segmented into novolac resin, resol resin, and others
Based on application type, the global phenolic resin market is segmented into wood adhesives, insulation, coatings, laminates, paper impregnation, foundry, molding compound, and others
On the basis of end-use, the market is segmented into automotive, furniture, electrical & electronics, building & construction, industrial, and others.
Geographically, Phenolic Resin market is segmented into North America, Europe, Asia Pacific, Latin America and The Middle East & Africa (LAMEA).
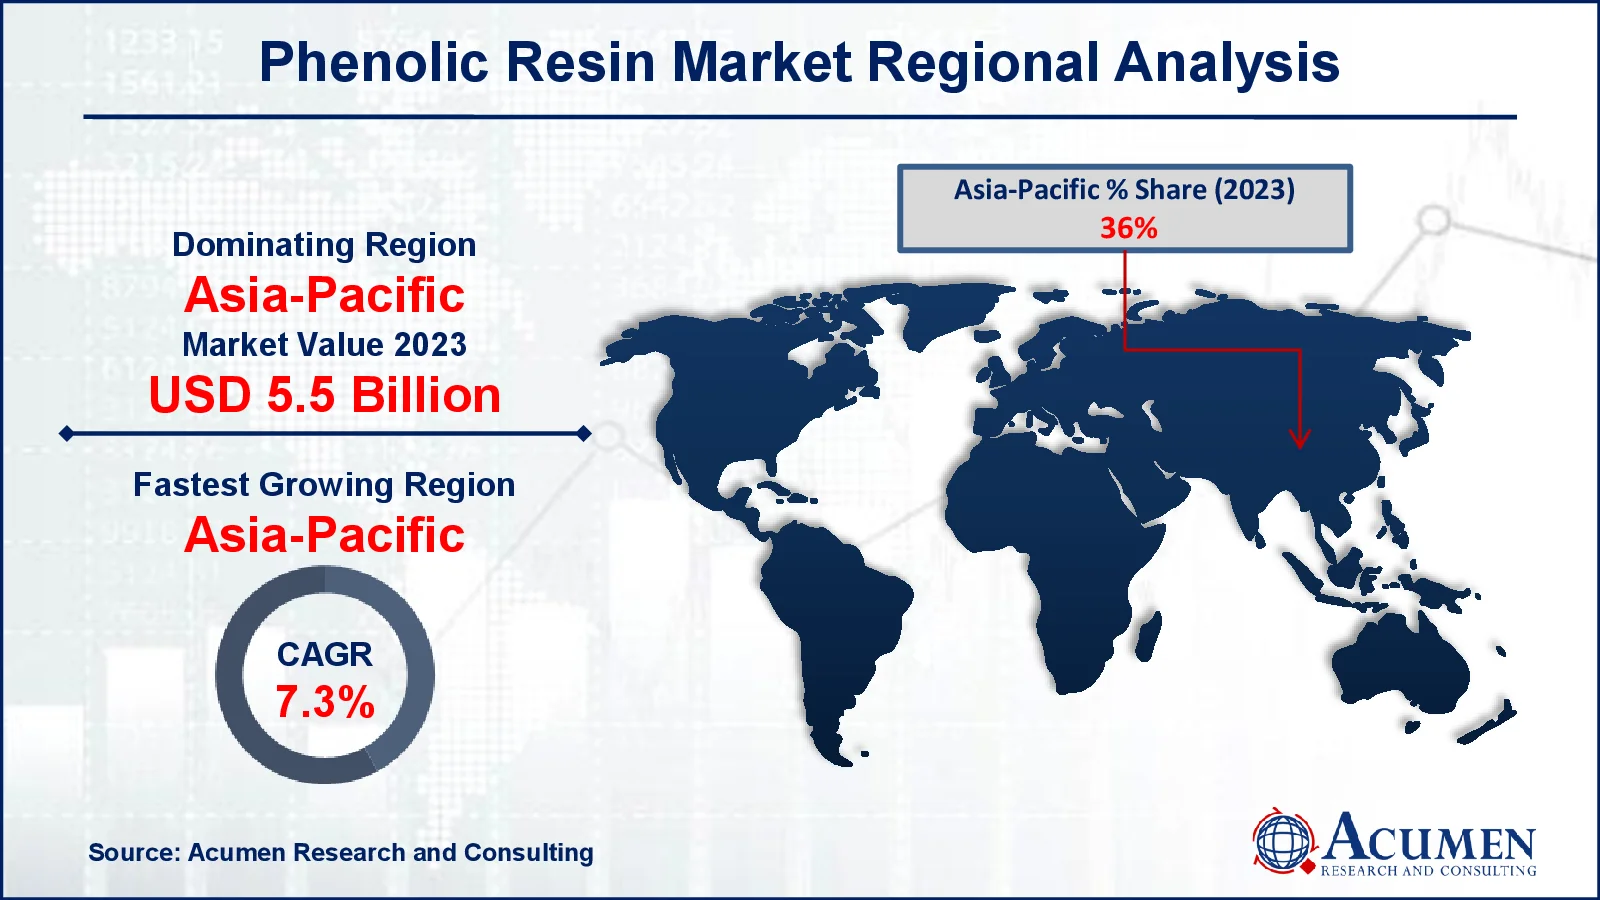
Asia-Pacific was the dominant market in the global phenolic resin market in 2018. The region accounted for largest market share both in terms of value and volume in 2018. Considerable economical growth across the major economies of the region such as China, India and Japan, and high demand from food and beverages, cosmetics and pharmaceutical packaging printing are some major growth driving factors in this region. Trend for aesthetic packaging in the cosmetic and food & beverage industry further encouraging the demand for phenolic resin. North America is the second largest market in this market followed by Europe. The phenolic resin market in North America is growing at a faster pace owing to various factors such as strict government regulations regarding environmental safety. Consumers are attracted to these sustainable solutions due to the environmental benefits such as reduced greenhouse emissions offered by the phenolic resin Constant efforts are being made to enhance new systems such as self-compressing bags.
On the other hand, LAMEA holds the least share in the phenolic resin market however, in hear future the market will possess the tremendous growth owing to the huge untapped opportunity, low labor cost and continuously increasing spending of the people.
Some of the major players analyzed and profiles in this market include Flint Group, Siegwerk Druckfarben AG & Co., Huber Group, Sun Chemical Corporation, Wikoff Color Corporation, Zeller+Gmelin GmbH & Co. KG., INX International Ink Co, Toyo Ink SC Holdings Co, ALTANA AG and XSYS Print Solutions (Shanghai) Ltd. among others.
CHAPTER 1. INDUSTRY OVERVIEW
1.1. Definition and Scope
1.1.1. Definition of Phenolic Resin
1.1.2. Market Segmentation
1.1.3. List of Abbreviations
1.2. Summary
1.2.1. Market Snapshot
1.2.2. Phenolic Resin Market By Type
1.2.2.1. Global Phenolic Resin Market Revenue and Growth Rate Comparison By Type (2015-2026)
1.2.2.2. Global Phenolic Resin Market Revenue Share By Type in 2017
1.2.2.3. Novolac Resin
1.2.2.4. Resol Resin
1.2.2.5. Others
1.2.3. Phenolic Resin Market By Application
1.2.3.1. Global Phenolic Resin Market Revenue and Growth Rate Comparison By Application (2015-2026)
1.2.3.2. Wood Adhesives
1.2.3.3. Insulation
1.2.3.4. Coatings
1.2.3.5. Laminates
1.2.3.6. Paper Impregnation
1.2.3.7. Foundry
1.2.3.8. Molding Compound
1.2.3.9. Others
1.2.4. Phenolic Resin Market By End User
1.2.4.1. Global Phenolic Resin Market Revenue and Growth Rate Comparison By End User (2015-2026)
1.2.4.2. Automotive
1.2.4.3. Furniture
1.2.4.4. Electrical & Electronics
1.2.4.5. Building & Construction
1.2.4.6. Industrial
1.2.4.7. Others
1.2.5. Phenolic Resin Market by Geography
1.2.5.1. Global Phenolic Resin Market Revenue and Growth Rate Comparison by Geography (2015-2026)
1.2.5.2. North America Phenolic Resin Market Revenue and Growth Rate (2015-2026)
1.2.5.3. Europe Phenolic Resin Market Revenue and Growth Rate (2015-2026)
1.2.5.4. Asia-Pacific Phenolic Resin Market Revenue and Growth Rate (2015-2026)
1.2.5.5. Latin America Phenolic Resin Market Revenue and Growth Rate (2015-2026)
1.2.5.6. Middle East and Africa (MEA) Phenolic Resin Market Revenue and Growth Rate (2015-2026)
CHAPTER 2. MARKET DYNAMICS AND COMPETITION ANALYSIS
2.1. Market Drivers
2.2. Restraints and Challenges
2.3. Growth Opportunities
2.4. Porter’s Five Forces Analysis
2.4.1. Bargaining Power of Suppliers
2.4.2. Bargaining Power of Buyers
2.4.3. Threat of Substitute
2.4.4. Threat of New Entrants
2.4.5. Degree of Competition
2.5. Value Chain Analysis
2.6. Cost Structure Analysis
2.6.1. Raw Material and Suppliers
2.6.2. Manufacturing Process Analysis
2.7. Regulatory Compliance
2.8. Competitive Landscape, 2017
2.8.1. Player Positioning Analysis
2.8.2. Key Strategies Adopted By Leading Players
CHAPTER 3. MANUFACTURING PLANTS ANALYSIS
3.1. Capacity and Commercial Production Date of Global Phenolic Resin Major Manufacturers in 2017
3.2. Manufacturing Plants Distribution of Global Phenolic Resin Major Manufacturers in 2017
3.3. R&D Status and Technology Type of Global Phenolic Resin Major Manufacturers in 2017
3.4. Raw Materials Sources Analysis of Global Phenolic Resin Major Manufacturers in 2017
CHAPTER 4. PHENOLIC RESIN MARKET BY TYPE
4.1. Global Phenolic Resin Revenue By Type
4.2. Novolac Resin
4.2.1. Market Revenue and Growth Rate, 2015 - 2026 ($Million)
4.2.2. Market Revenue and Forecast, By Region, 2015 - 2026 ($Million)
4.3. Resol Resin
4.3.1. Market Revenue and Growth Rate, 2015 - 2026 ($Million)
4.3.2. Market Revenue and Forecast, By Region, 2015 - 2026 ($Million)
4.4. Others
4.4.1. Market Revenue and Growth Rate, 2015 - 2026 ($Million)
4.4.2. Market Revenue and Forecast, By Region, 2015 - 2026 ($Million)
CHAPTER 5. PHENOLIC RESIN MARKET BY APPLICATION
5.1. Global Phenolic Resin Revenue By Application
5.2. Wood Adhesives
5.2.1. Market Revenue and Growth Rate, 2015 - 2026 ($Million)
5.2.2. Market Revenue and Forecast, By Region, 2015 - 2026 ($Million)
5.3. Insulation
5.3.1. Market Revenue and Growth Rate, 2015 - 2026 ($Million)
5.3.2. Market Revenue and Forecast, By Region, 2015 - 2026 ($Million)
5.4. Coatings
5.4.1. Market Revenue and Growth Rate, 2015 - 2026 ($Million)
5.4.2. Market Revenue and Forecast, By Region, 2015 - 2026 ($Million)
5.5. Laminates
5.5.1. Market Revenue and Growth Rate, 2015 - 2026 ($Million)
5.5.2. Market Revenue and Forecast, By Region, 2015 - 2026 ($Million)
5.6. Paper Impregnation
5.6.1. Market Revenue and Growth Rate, 2015 - 2026 ($Million)
5.6.2. Market Revenue and Forecast, By Region, 2015 - 2026 ($Million)
5.7. Foundry
5.7.1. Market Revenue and Growth Rate, 2015 - 2026 ($Million)
5.7.2. Market Revenue and Forecast, By Region, 2015 - 2026 ($Million)
5.8. Molding Compound
5.8.1. Market Revenue and Growth Rate, 2015 - 2026 ($Million)
5.8.2. Market Revenue and Forecast, By Region, 2015 - 2026 ($Million)
5.9. Others
5.9.1. Market Revenue and Growth Rate, 2015 - 2026 ($Million)
5.9.2. Market Revenue and Forecast, By Region, 2015 - 2026 ($Million)
CHAPTER 6. PHENOLIC RESIN MARKET BY END USER
6.1. Global Phenolic Resin Revenue By End User
6.2. Automotive
6.2.1. Market Revenue and Growth Rate, 2015 - 2026 ($Million)
6.2.2. Market Revenue and Forecast, By Region, 2015 - 2026 ($Million)
6.3. Furniture
6.3.1. Market Revenue and Growth Rate, 2015 - 2026 ($Million)
6.3.2. Market Revenue and Forecast, By Region, 2015 - 2026 ($Million)
6.4. Electrical & Electronics
6.4.1. Market Revenue and Growth Rate, 2015 - 2026 ($Million)
6.4.2. Market Revenue and Forecast, By Region, 2015 - 2026 ($Million)
6.5. Building & Construction
6.5.1. Market Revenue and Growth Rate, 2015 - 2026 ($Million)
6.5.2. Market Revenue and Forecast, By Region, 2015 - 2026 ($Million)
6.6. Industrial
6.6.1. Market Revenue and Growth Rate, 2015 - 2026 ($Million)
6.6.2. Market Revenue and Forecast, By Region, 2015 - 2026 ($Million)
6.7. Others
6.7.1. Market Revenue and Growth Rate, 2015 - 2026 ($Million)
6.7.2. Market Revenue and Forecast, By Region, 2015 - 2026 ($Million)
CHAPTER 7. NORTH AMERICA PHENOLIC RESIN MARKET BY COUNTRY
7.1. North America Phenolic Resin Market Revenue and Growth Rate, 2015 - 2026 ($Million)
7.2. North America Phenolic Resin Market Revenue Share Comparison, 2015 & 2026 (%)
7.3. U.S.
7.3.1. U.S. Phenolic Resin Market Revenue and Forecast By Type, 2015 - 2026 ($Million)
7.3.2. Market Revenue and Forecast By Application, 2015 - 2026 ($Million)
7.3.3. Market Revenue and Forecast By End User, 2015 - 2026 ($Million)
7.4. Canada
7.4.1. Market Revenue and Forecast By Type, 2015 - 2026 ($Million)
7.4.2. Market Revenue and Forecast By Application, 2015 - 2026 ($Million)
7.4.3. Market Revenue and Forecast By End User, 2015 - 2026 ($Million)
7.5. Mexico
7.5.1. Market Revenue and Forecast By Type, 2015 - 2026 ($Million)
7.5.2. Market Revenue and Forecast By Application, 2015 - 2026 ($Million)
7.5.3. Market Revenue and Forecast By End User, 2015 - 2026 ($Million)
CHAPTER 8. EUROPE PHENOLIC RESIN MARKET BY COUNTRY
8.1. Europe Phenolic Resin Market Revenue and Growth Rate, 2015 - 2026 ($Million)
8.2. Europe Phenolic Resin Market Revenue Share Comparison, 2015 & 2026 (%)
8.3. UK
8.3.1. Market Revenue and Forecast By Type, 2015 - 2026 ($Million)
8.3.2. Market Revenue and Forecast By Application, 2015 - 2026 ($Million)
8.3.3. Market Revenue and Forecast By End User, 2015 - 2026 ($Million)
8.4. Germany
8.4.1. Market Revenue and Forecast By Type, 2015 - 2026 ($Million)
8.4.2. Market Revenue and Forecast By Application, 2015 - 2026 ($Million)
8.4.3. Market Revenue and Forecast By End User, 2015 - 2026 ($Million)
8.5. France
8.5.1. Market Revenue and Forecast By Type, 2015 - 2026 ($Million)
8.5.2. Market Revenue and Forecast By Application, 2015 - 2026 ($Million)
8.5.3. Market Revenue and Forecast By End User, 2015 - 2026 ($Million)
8.6. Spain
8.6.1. Market Revenue and Forecast By Type, 2015 - 2026 ($Million)
8.6.2. Market Revenue and Forecast By Application, 2015 - 2026 ($Million)
8.6.3. Market Revenue and Forecast By End User, 2015 - 2026 ($Million)
8.7. Rest of Europe
8.7.1. Market Revenue and Forecast By Type, 2015 - 2026 ($Million)
8.7.2. Market Revenue and Forecast By Application, 2015 - 2026 ($Million)
8.7.3. Market Revenue and Forecast By End User, 2015 - 2026 ($Million)
CHAPTER 9. ASIA-PACIFIC PHENOLIC RESIN MARKET BY COUNTRY
9.1. Asia-Pacific Phenolic Resin Market Revenue and Growth Rate, 2015 - 2026 ($Million)
9.2. Asia-Pacific Phenolic Resin Market Revenue Share Comparison, 2015 & 2026 (%)
9.3. China
9.3.1. Market Revenue and Forecast By Type, 2015 - 2026 ($Million)
9.3.2. Market Revenue and Forecast By Application, 2015 - 2026 ($Million)
9.3.3. Market Revenue and Forecast By End User, 2015 - 2026 ($Million)
9.4. Japan
9.4.1. Market Revenue and Forecast By Type, 2015 - 2026 ($Million)
9.4.2. Market Revenue and Forecast By Application, 2015 - 2026 ($Million)
9.4.3. Market Revenue and Forecast By End User, 2015 - 2026 ($Million)
9.5. India
9.5.1. Market Revenue and Forecast By Type, 2015 - 2026 ($Million)
9.5.2. Market Revenue and Forecast By Application, 2015 - 2026 ($Million)
9.5.3. Market Revenue and Forecast By End User, 2015 - 2026 ($Million)
9.6. Australia
9.6.1. Market Revenue and Forecast By Type, 2015 - 2026 ($Million)
9.6.2. Market Revenue and Forecast By Application, 2015 - 2026 ($Million)
9.6.3. Market Revenue and Forecast By End User, 2015 - 2026 ($Million)
9.7. South Korea
9.7.1. Market Revenue and Forecast By Type, 2015 - 2026 ($Million)
9.7.2. Market Revenue and Forecast By Application, 2015 - 2026 ($Million)
9.7.3. Market Revenue and Forecast By End User, 2015 - 2026 ($Million)
9.8. Rest of Asia-Pacific
9.8.1. Market Revenue and Forecast By Type, 2015 - 2026 ($Million)
9.8.2. Market Revenue and Forecast By Application, 2015 - 2026 ($Million)
9.8.3. Market Revenue and Forecast By End User, 2015 - 2026 ($Million)
CHAPTER 10. LATIN AMERICA PHENOLIC RESIN MARKET BY COUNTRY
10.1. Latin America Phenolic Resin Market Revenue and Growth Rate, 2015 - 2026 ($Million)
10.2. Latin America Phenolic Resin Market Revenue Share Comparison, 2015 & 2026 (%)
10.3. Brazil
10.3.1. Market Revenue and Forecast By Type, 2015 - 2026 ($Million)
10.3.2. Market Revenue and Forecast By Application, 2015 - 2026 ($Million)
10.3.3. Market Revenue and Forecast By End User, 2015 - 2026 ($Million)
10.4. Argentina
10.4.1. Market Revenue and Forecast By Type, 2015 - 2026 ($Million)
10.4.2. Market Revenue and Forecast By Application, 2015 - 2026 ($Million)
10.4.3. Market Revenue and Forecast By End User, 2015 - 2026 ($Million)
10.5. Rest of Latin America
10.5.1. Market Revenue and Forecast By Type, 2015 - 2026 ($Million)
10.5.2. Market Revenue and Forecast By Application, 2015 - 2026 ($Million)
10.5.3. Market Revenue and Forecast By End User, 2015 - 2026 ($Million)
CHAPTER 11. MIDDLE EAST PHENOLIC RESIN MARKET BY COUNTRY
11.1. Middle East Phenolic Resin Market Revenue and Growth Rate, 2015 - 2026 ($Million)
11.2. Middle East Phenolic Resin Market Revenue Share Comparison, 2015 & 2026 (%)
11.3. Saudi Arabia
11.3.1. Market Revenue and Forecast By Type, 2015 - 2026 ($Million)
11.3.2. Market Revenue and Forecast By Application, 2015 - 2026 ($Million)
11.3.3. Market Revenue and Forecast By End User, 2015 - 2026 ($Million)
11.4. UAE
11.4.1. Market Revenue and Forecast By Type, 2015 - 2026 ($Million)
11.4.2. Market Revenue and Forecast By Application, 2015 - 2026 ($Million)
11.4.3. Market Revenue and Forecast By End User, 2015 - 2026 ($Million)
11.5. Rest of Middle East
11.5.1. Market Revenue and Forecast By Type, 2015 - 2026 ($Million)
11.5.2. Market Revenue and Forecast By Application, 2015 - 2026 ($Million)
11.5.3. Market Revenue and Forecast By End User, 2015 - 2026 ($Million)
CHAPTER 12. AFRICA PHENOLIC RESIN MARKET BY COUNTRY
12.1. Africa Phenolic Resin Market Revenue and Growth Rate, 2015 - 2026 ($Million)
12.2. Africa Phenolic Resin Market Revenue Share Comparison, 2015 & 2026 (%)
12.3. South Africa
12.3.1. Market Revenue and Forecast By Type, 2015 - 2026 ($Million)
12.3.2. Market Revenue and Forecast By Application, 2015 - 2026 ($Million)
12.3.3. Market Revenue and Forecast By End User, 2015 - 2026 ($Million)
12.4. Egypt
12.4.1. Market Revenue and Forecast By Type, 2015 - 2026 ($Million)
12.4.2. Market Revenue and Forecast By Application, 2015 - 2026 ($Million)
12.4.3. Market Revenue and Forecast By End User, 2015 - 2026 ($Million)
12.5. Rest of Africa
12.5.1. Market Revenue and Forecast By Type, 2015 - 2026 ($Million)
12.5.2. Market Revenue and Forecast By Application, 2015 - 2026 ($Million)
12.5.3. Market Revenue and Forecast By End User, 2015 - 2026 ($Million)
CHAPTER 13. COMPANY PROFILE
13.1. Flint Group
13.1.1. Company Snapshot
13.1.2. Overview
13.1.3. Financial Overview
13.1.4. Type Portfolio
13.1.5. Key Developments
13.1.6. Strategies
13.2. Siegwerk Druckfarben AG & Co.
13.2.1. Company Snapshot
13.2.2. Overview
13.2.3. Financial Overview
13.2.4. Type Portfolio
13.2.5. Key Developments
13.2.6. Strategies
13.3. Huber Group
13.3.1. Company Snapshot
13.3.2. Overview
13.3.3. Financial Overview
13.3.4. Type Portfolio
13.3.5. Key Developments
13.3.6. Strategies
13.4. Sun Chemical Corporation
13.4.1. Company Snapshot
13.4.2. Overview
13.4.3. Financial Overview
13.4.4. Type Portfolio
13.4.5. Key Developments
13.4.6. Strategies
13.5. Wikoff Color Corporation
13.5.1. Company Snapshot
13.5.2. Overview
13.5.3. Financial Overview
13.5.4. Type Portfolio
13.5.5. Key Developments
13.5.6. Strategies
13.6. Zeller+Gmelin GmbH & Co. KG.
13.6.1. Company Snapshot
13.6.2. Overview
13.6.3. Financial Overview
13.6.4. Type Portfolio
13.6.5. Key Developments
13.6.6. Strategies
13.7. INX International Ink Co
13.7.1. Company Snapshot
13.7.2. Overview
13.7.3. Financial Overview
13.7.4. Type Portfolio
13.7.5. Key Developments
13.7.6. Strategies
13.8. Toyo Ink SC Holdings Co
13.8.1. Company Snapshot
13.8.2. Overview
13.8.3. Financial Overview
13.8.4. Type Portfolio
13.8.5. Key Developments
13.8.6. Strategies
13.9. ALTANA AG
13.9.1. Company Snapshot
13.9.2. Overview
13.9.3. Financial Overview
13.9.4. Type Portfolio
13.9.5. Key Developments
13.9.6. Strategies
13.10. XSYS Print Solutions (Shanghai) Ltd
13.10.1. Company Snapshot
13.10.2. Overview
13.10.3. Financial Overview
13.10.4. Type Portfolio
13.10.5. Key Developments
13.10.6. Strategies
13.11. Others
13.11.1. Company Snapshot
13.11.2. Overview
13.11.3. Financial Overview
13.11.4. Type Portfolio
13.11.5. Key Developments
13.11.6. Strategies
CHAPTER 14. RESEARCH APPROACH
14.1. Research Methodology
14.1.1. Initial Data Search
14.1.2. Secondary Research
14.1.3. Primary Research
14.2. Assumptions and Scope